
US Market Intelligence Brief
Report as-of (US/Eastern): 2026-07-16 15:32:22 EDT
Executive summary
Report as-of (US/Eastern): 2026-07-16 15:32:22 EDT
The US market is experiencing significant volatility today with mega-cap tech under pressure while healthcare shows resilience. Alphabet (GOOGL/GOOG) leads declines with -4.4% drops, while UnitedHealth (UNH) bucked the trend with +1.74% gains. High-growth names are seeing severe corrections, with space/satellite stocks ASTS (-17.9%) and RKLB (-11.96%) leading losses alongside energy infrastructure play BE (-13.09%). The divergence between defensive healthcare and growth tech suggests risk-off sentiment amid potential sector rotation.
Market regime check (S&P 500 + sector/thematic ETFs)
While specific ETF data wasn't captured, the trending stocks reveal a clear risk-off environment. Mega-cap tech (GOOGL/GOOG) selling pressure suggests potential Nasdaq weakness, while UNH's outperformance indicates defensive rotation into healthcare. The severe declines in space/satellite infrastructure (ASTS, RKLB) and clean energy (BE) point to growth-to-value rotation accelerating. High volume across declining names (ASTS: 44.8M, GOOGL: 28.5M) confirms institutional repositioning rather than retail-driven moves.
Why these names are trending (search momentum + weekly/monthly price action)
Alphabet (GOOGL/GOOG): Despite -4.4% today, monthly trends remain modest (-3.6% to -4.0%), suggesting today's move may be catalyst-driven rather than fundamental deterioration.
UnitedHealth (UNH): Positive momentum with +3.62% monthly gains accelerating to +1.74% today, indicating defensive healthcare rotation.
High-growth casualties: ASTS (-37.85% monthly), RKLB (-38.56% monthly), and BE (-24.18% monthly) show sustained selling pressure over weeks, not just today's action.
Robinhood (HOOD): Mixed signals with +8.39% monthly gains but -7.95% today and -7.61% weekly, suggesting profit-taking after recent strength.
Key news drivers
Limited specific catalysts captured, but several themes emerge:
- AI sector dynamics: Headlines around OpenAI leadership changes and Apple-OpenAI legal disputes may be pressuring tech broadly
- Space sector weakness: SpaceX hitting new lows suggests broader space infrastructure selloff affecting ASTS/RKLB
- Infrastructure spending: Bloom Energy's $1.7B fuel cell commitment provides positive backdrop, but not offsetting broader clean energy rotation
- Regulatory uncertainty: AI regulation discussions may be creating tech sector overhang
Durable momentum ideas (mid/high-cap focus)
UnitedHealth (UNH) – Bullish momentum: $425.79 (+1.74%)
- Why sustainable: Healthcare defensive rotation accelerating, strong monthly trend (+3.62%), mega-cap quality during uncertainty
- Catalyst potential: Earnings season approaching, potential healthcare policy clarity
Alphabet (GOOGL/GOOG) – Contrarian opportunity: ~$354 (-4.4%)
- Why durable: Modest monthly declines (-3.6%) vs today's sharp move suggests oversold condition, AI infrastructure positioning intact
- Risk: Further tech rotation could extend weakness
Avoid for momentum: Space/satellite names (ASTS, RKLB) showing -26% to -38% monthly declines with no clear fundamental catalysts for reversal.
Options / structure ideas
Educational analysis only – not investment advice
UNH (Primary: CALL structures)
- Call-side: Bull call spread 425/435 for earnings run-up, or covered calls at 430-435 resistance
- Put-side: Cash-secured puts at 415-420 support for entry on any pullback
- Rationale: Defensive momentum with lower volatility than growth names
GOOGL/GOOG (Primary: CALL structures – contrarian)
- Call-side: Long calls 360-365 strikes for bounce play, or bull call spreads for defined risk
- Put-side: Protective puts 350 level if holding shares through volatility
- Rationale: Oversold condition in quality mega-cap with AI positioning
ASTS (Primary: PUT structures)
- Put-side: Put debit spreads 54/50 or 54/48 capturing continued weakness
- Call-side: Covered calls 58-60 if holding shares, selling premium against bounces
- Rationale: Severe technical damage with -37% monthly decline
HOOD (Primary: PUT structures)
- Put-side: Put debit spreads 106/100 on profit-taking continuation
- Call-side: Wait for 108-110 bounce for call credit spreads
- Rationale: Monthly gains being unwound, fintech sector rotation risk
Risks & watch-outs
Immediate risks:
- Volatility crush: High IV environment across declining names creates time decay risk
- Sector rotation acceleration: Growth-to-value shift could extend tech weakness
- Earnings season: Q2 results starting could create additional volatility
Structural concerns:
- Space sector fundamentals: ASTS/RKLB declines may reflect valuation reality vs growth expectations
- AI regulation overhang: Policy uncertainty creating tech sector headwinds
- Interest rate sensitivity: Growth names vulnerable to any hawkish Fed signals
Execution risks:
- Wide bid/ask spreads: High volatility creating poor liquidity in options
- Gap risk: Overnight moves could invalidate technical levels quickly
- Volume confirmation: Ensure institutional volume supports any momentum plays
*All options analysis is educational only and not financial advice. Consider your risk tolerance and consult a financial advisor.*
Visual strategy maps
Payoff curves and entry/exit zones below are educational aids — not trade instructions. Confirm with your own chart, liquidity, and risk limits.
ASTS: Bear Put Spread
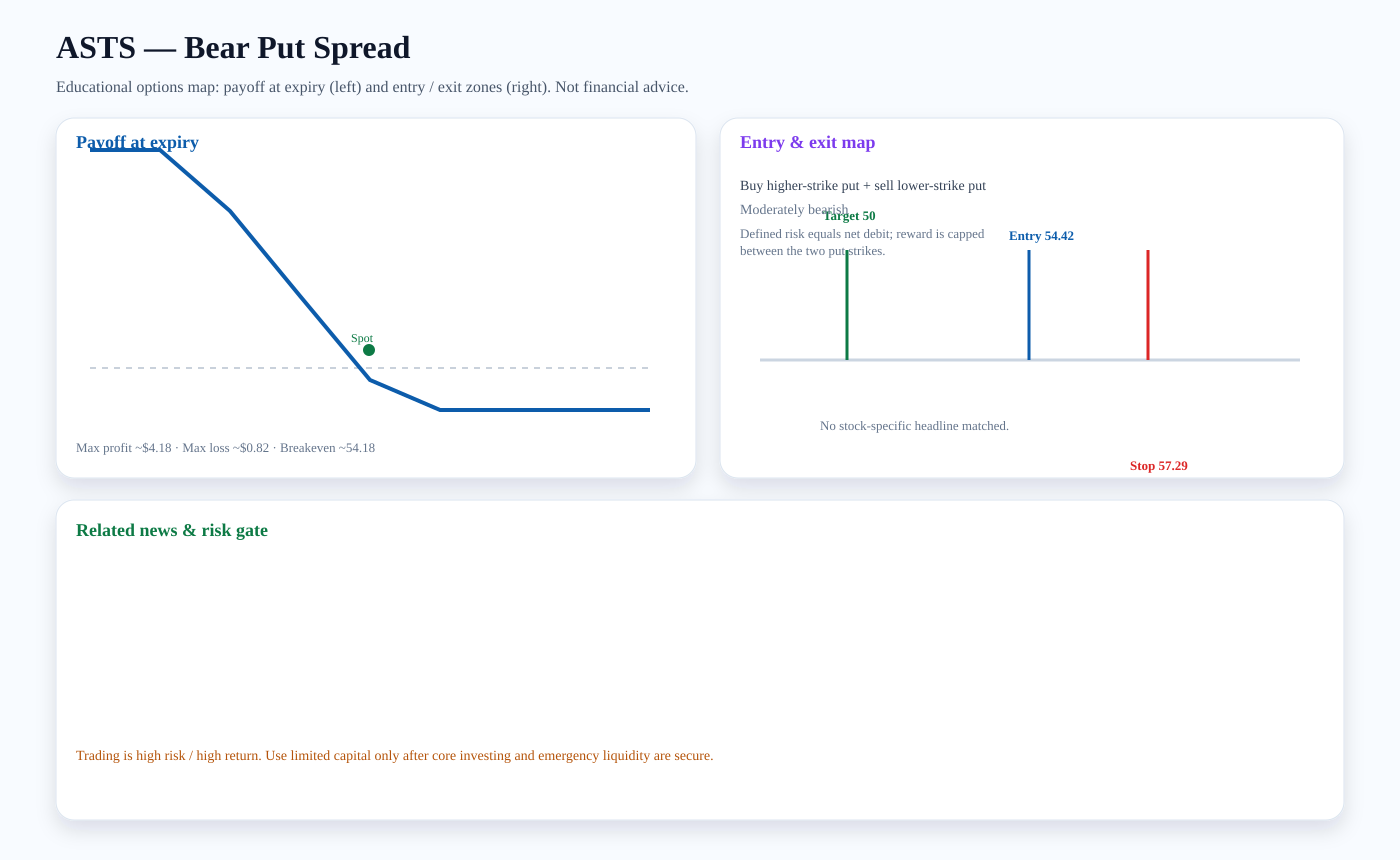
Structure: Buy higher-strike put + sell lower-strike put
Outlook: Moderately bearish
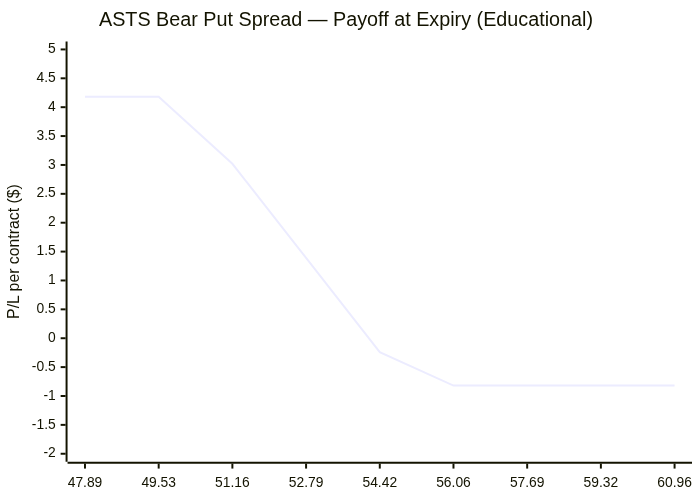
Entry zone: ~54.42 · Target: ~50 · Stop: ~57.29 · Breakeven: ~54.18
Risk note: Defined risk equals net debit; reward is capped between the two put strikes.
Payoff chart (Mermaid):
Entry / exit map (Mermaid):

RKLB: Bear Put Spread
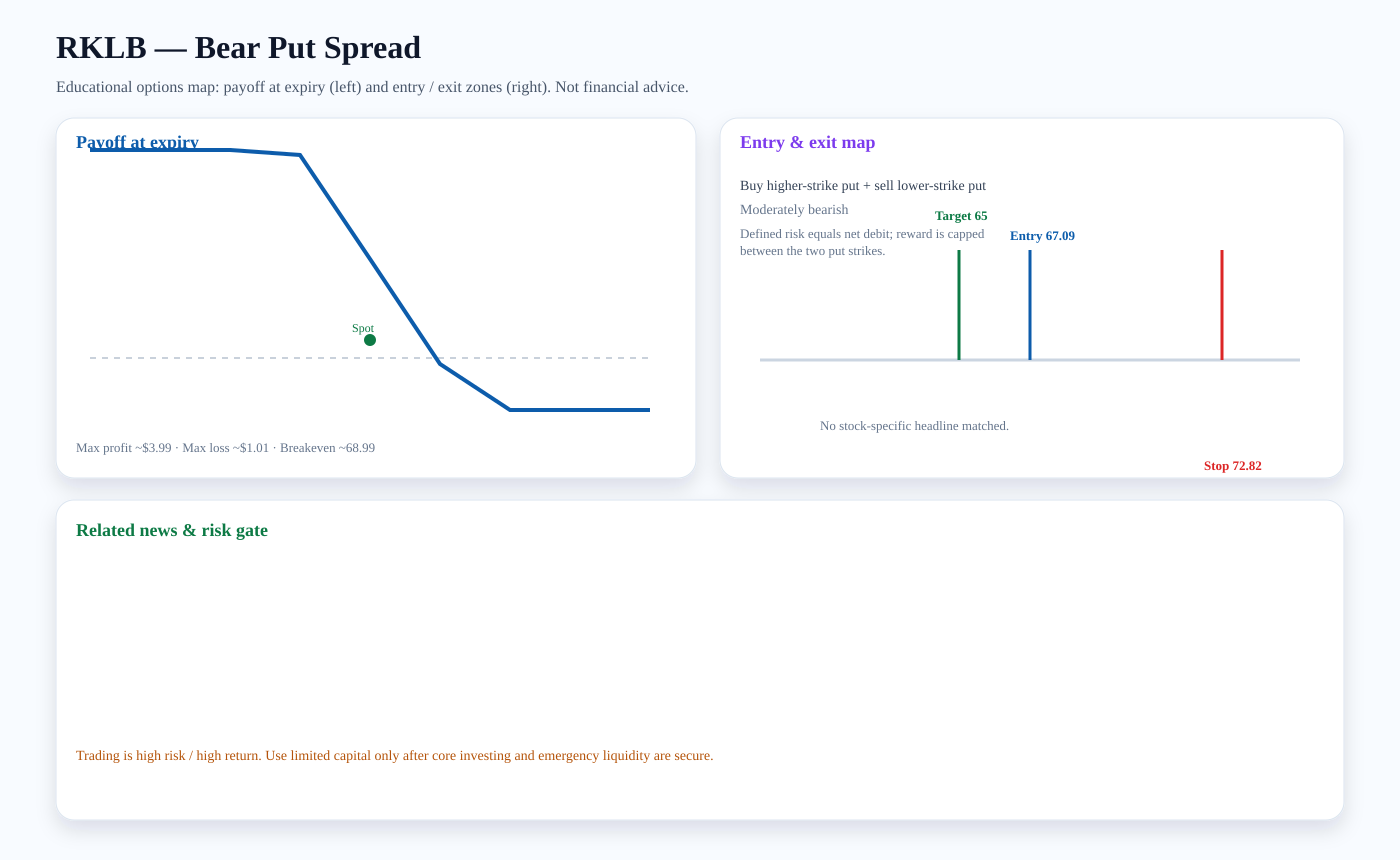
Structure: Buy higher-strike put + sell lower-strike put
Outlook: Moderately bearish
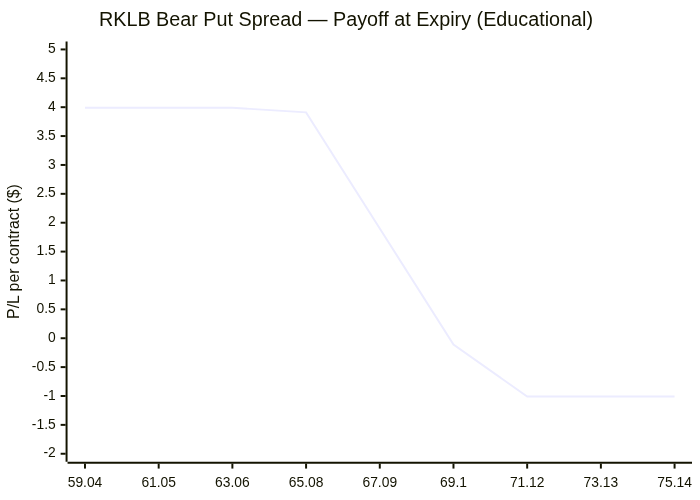
Entry zone: ~67.09 · Target: ~65 · Stop: ~72.82 · Breakeven: ~68.99
Risk note: Defined risk equals net debit; reward is capped between the two put strikes.
Payoff chart (Mermaid):
Entry / exit map (Mermaid):

NBIS: Bear Put Spread
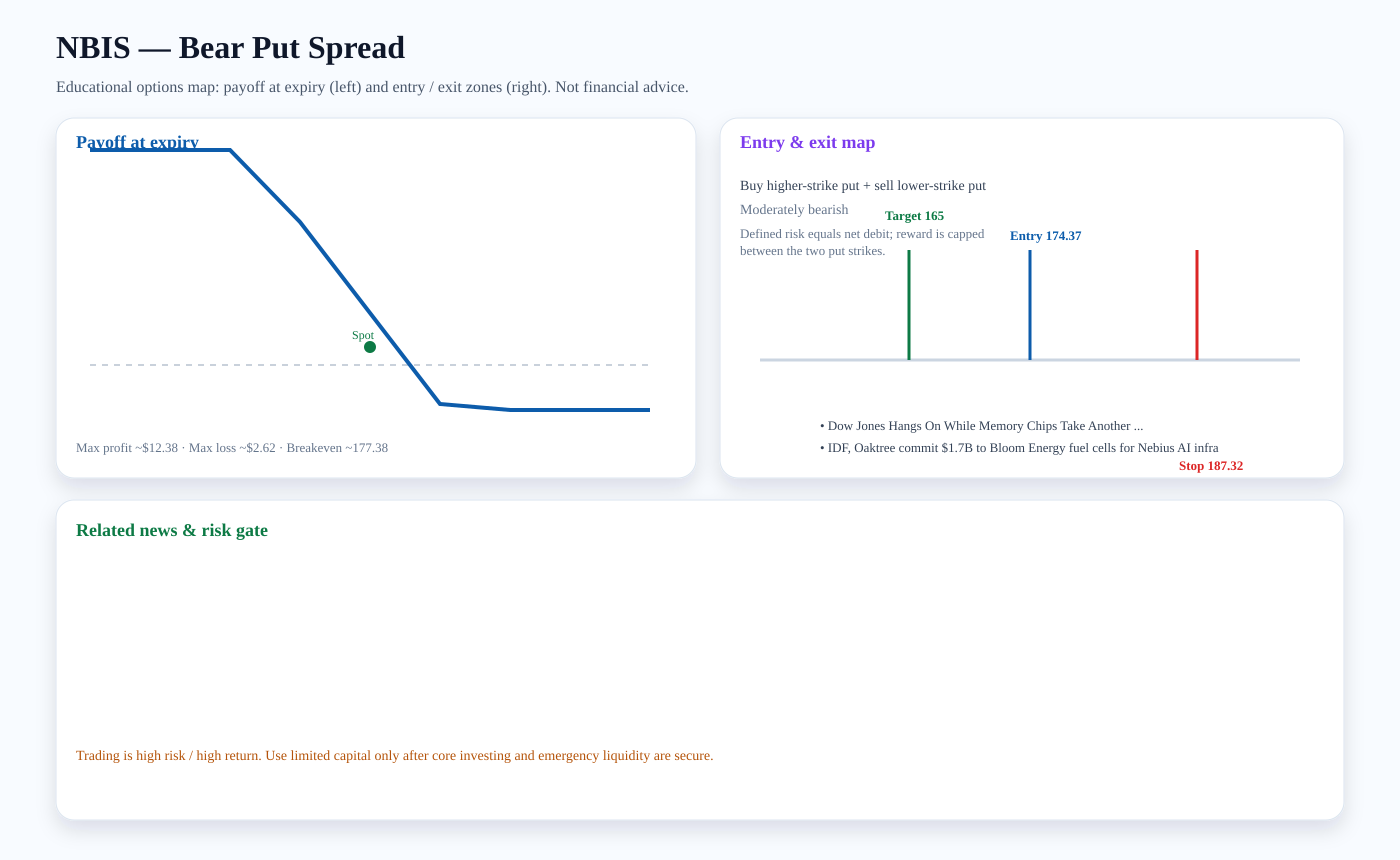
Structure: Buy higher-strike put + sell lower-strike put
Outlook: Moderately bearish
Entry zone: ~174.37 · Target: ~165 · Stop: ~187.32 · Breakeven: ~177.38
Risk note: Defined risk equals net debit; reward is capped between the two put strikes.
Related news links:
Payoff chart (Mermaid):
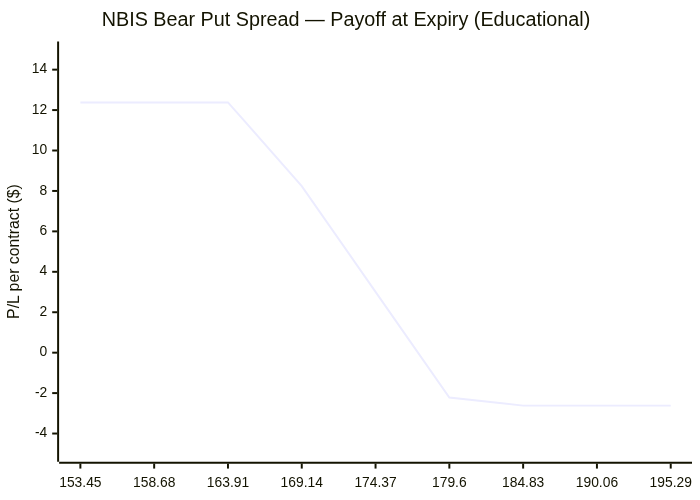
Entry / exit map (Mermaid):

BE: Bear Put Spread
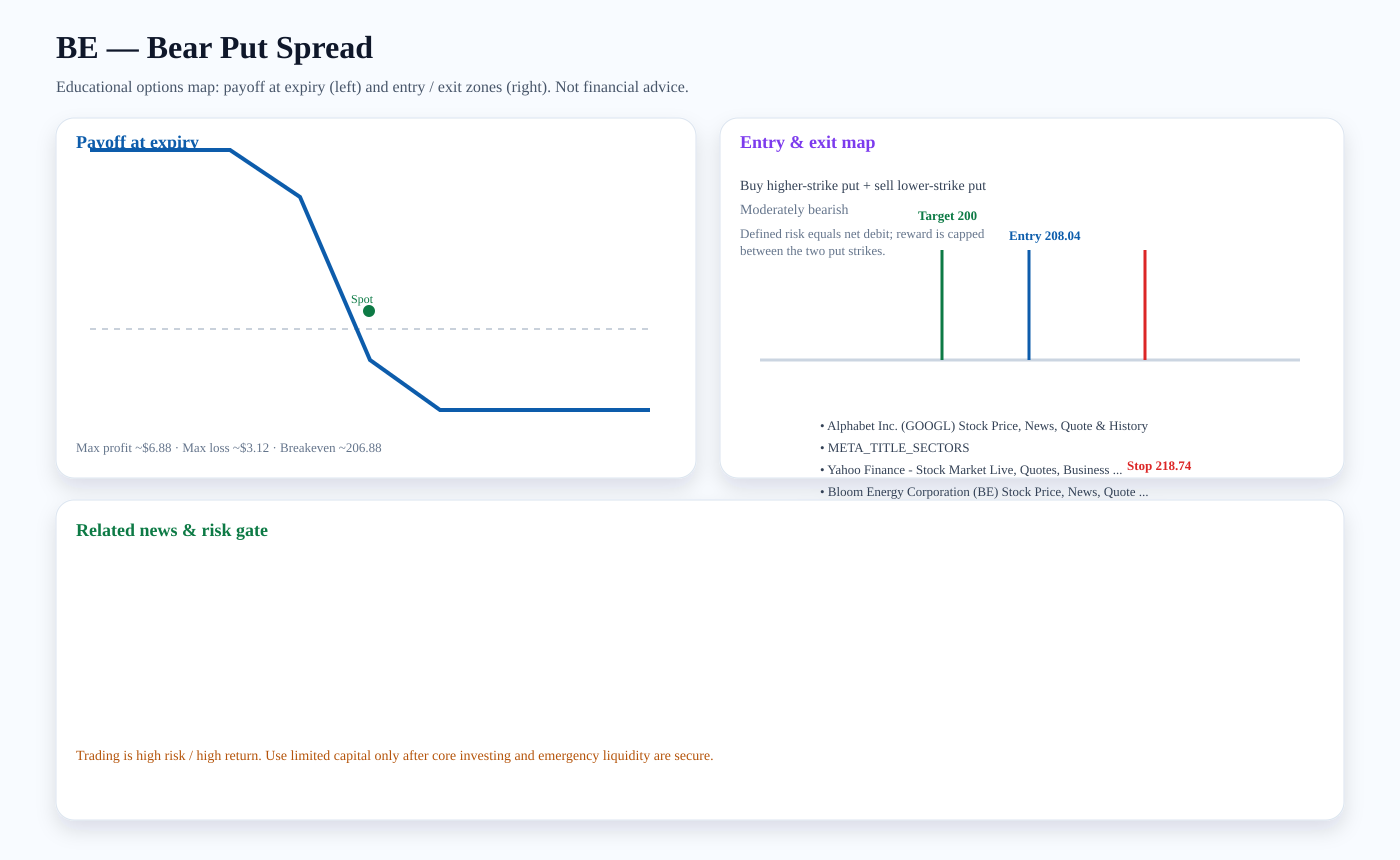
Structure: Buy higher-strike put + sell lower-strike put
Outlook: Moderately bearish
Entry zone: ~208.04 · Target: ~200 · Stop: ~218.74 · Breakeven: ~206.88
Risk note: Defined risk equals net debit; reward is capped between the two put strikes.
Related news links:
Payoff chart (Mermaid):
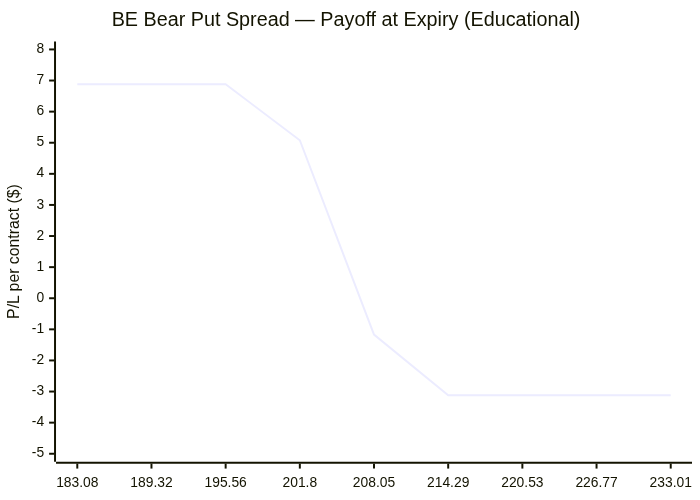
Entry / exit map (Mermaid):

Trading versus investing
Investing focuses on durable ownership, diversification, and compounding. Trading seeks faster tactical returns and carries higher risk. We treat options trading as limited-capital, educational analysis only after core investment capital and emergency liquidity are protected.
PDF report — Premium
Premium members get the full PDF attached to email briefs and can download it here. Upgrade for just $2 a month.
Subscribe for $2/month