
India (NSE) Market Intelligence Brief
Report as-of (US/Eastern): 2026-07-21 05:30:23 EDT
Data sources: NSE pre-open F&O and NSE derivatives quotes
Executive summary
Report as-of (US/Eastern): 2026-07-21 05:30:23 EDT
NSE market analysis is severely constrained due to widespread data connectivity issues. All major data sources including NSE pre-open F&O page and NSE official derivatives quote pages are experiencing timeouts, preventing reliable assessment of current market conditions. No index data (NIFTY, BANKNIFTY, MIDCPNIFTY) was retrieved, and all major stock quotes show ₹0.0 with zero volume, indicating complete data failure rather than actual market conditions.
Key limitation: This report cannot provide actionable insights due to data source failures. Traders should verify market conditions directly through NSE terminals before making any trading decisions.
Index & F&O pre-open regime
Data Status: No NSE index data retrieved due to connection timeouts.
The following indices could not be assessed:
- NIFTY 50: Data unavailable
- BANKNIFTY: Data unavailable
- MIDCPNIFTY: Data unavailable
- Other sectoral indices: Data unavailable
F&O Pre-open snapshot: All major stocks showing ₹0.0 pricing with zero volume, indicating data feed issues rather than actual market conditions.
Largest movers by %
Large cap
Data connectivity issues prevent reliable large-cap mover identification. Major stocks (RELIANCE, TCS, INFY, HDFCBANK, ICICIBANK) all showing ₹0.0 with zero volume.
Mid cap
No mid-cap data available due to NSE connection timeouts.
Small cap (high risk — proceed with caution)
CAUTION: Small-cap stocks carry significantly higher risk due to lower liquidity and higher volatility. Even when data is available, investors should proceed with extreme caution and use only limited risk capital after securing core portfolio investments. Current data unavailability makes small-cap assessment impossible.
Related news drivers
No valid news headlines captured from India news sources due to data feed issues. Market-moving news analysis cannot be provided at this time.
NSE options structure ideas (educational)
Educational disclaimer: All analysis below is for educational purposes only and not financial advice.
Due to complete options chain data failure across all major stocks (RELIANCE, TCS, INFY, HDFCBANK, ICICIBANK), no specific structure recommendations can be provided. Key limitations:
- No current pricing: Cannot establish directional bias
- No options chains: Strike selection impossible
- No implied volatility data: Cannot assess option premiums
- No expiry information: Tenor selection unavailable
- No liquidity metrics: Bid/ask assessment impossible
Primary recommendation: NO TRADE until data connectivity is restored.
Typical structures (when data available):
- Call-side: Call debit spreads for bullish positioning
- Put-side: Put debit spreads or protective puts for bearish/hedging strategies
Risks & watch-outs
Critical data risks:
- Complete data failure: NSE pre-open F&O data and official derivatives pages experiencing widespread timeouts
- Market timing uncertainty: Cannot verify if markets are in pre-open, open, or closed status
- Price discovery failure: Zero pricing across all major stocks indicates systemic data issues
Trading risks:
- Execution risk: Without current pricing, any trades would be executed blind
- Liquidity risk: Cannot assess bid/ask spreads or volume
- Gap risk: Market gaps cannot be identified without reliable price data
Small-cap specific risks (when data available):
- Liquidity constraints: Lower trading volumes increase execution risk
- Higher volatility: Price swings can be extreme and unpredictable
- Gap risk amplified: Small-caps more prone to significant overnight gaps
Recommendation: Wait for NSE data connectivity restoration before considering any F&O positions. Verify market conditions through direct NSE terminal access or authorized brokers.
Visual strategy maps
Payoff curves and entry/exit zones below are educational aids — not trade instructions. Confirm with your own chart, liquidity, and risk limits.
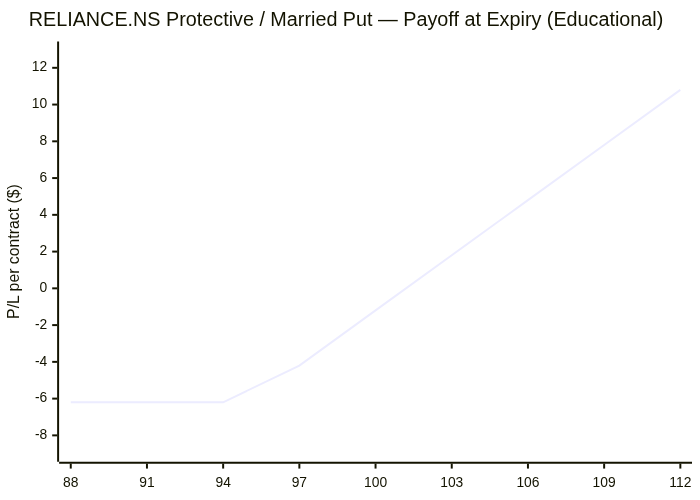
RELIANCE.NS: Protective / Married Put
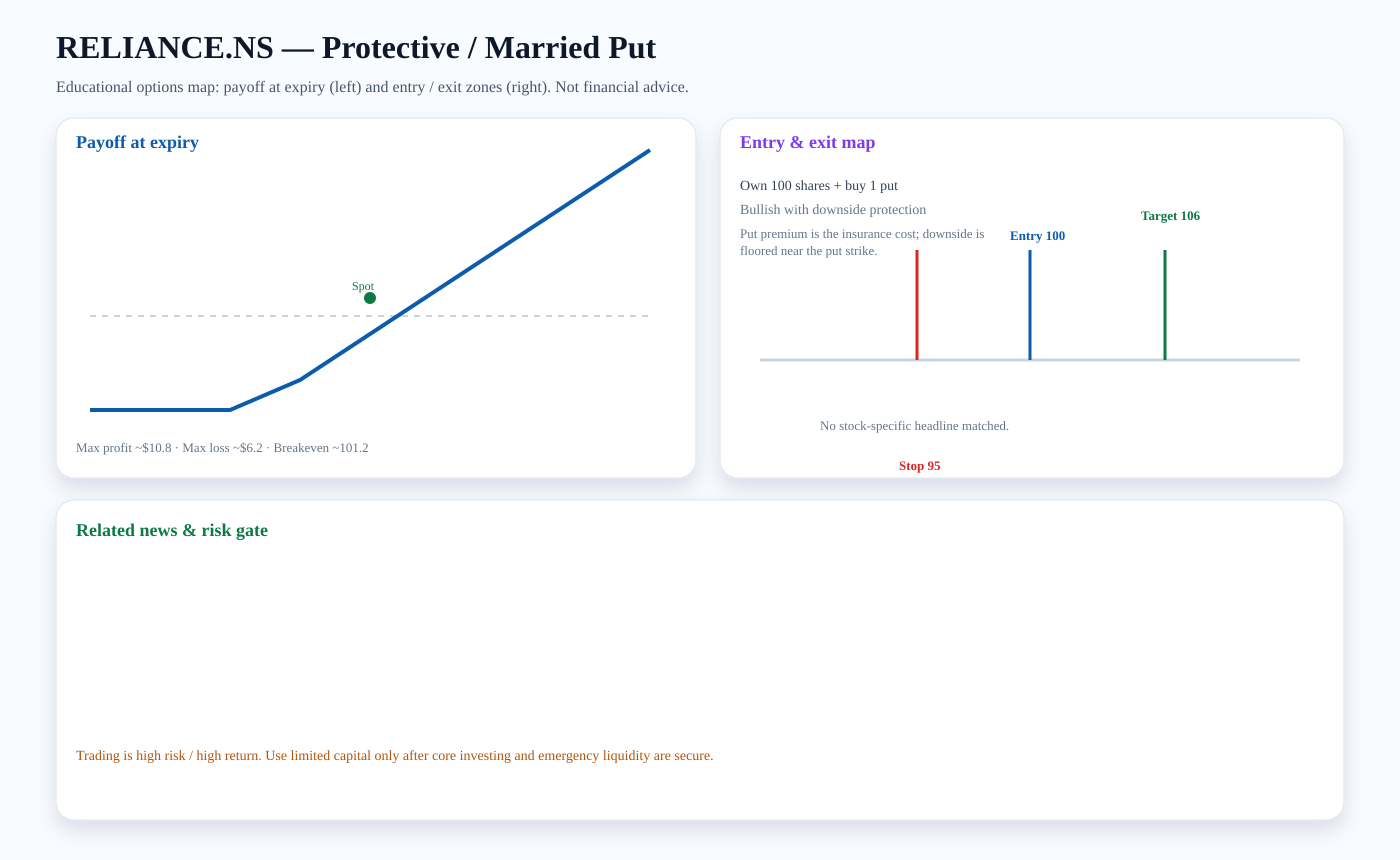
Structure: Own 100 shares + buy 1 put
Outlook: Bullish with downside protection
Entry zone: ~100 · Target: ~106 · Stop: ~95 · Breakeven: ~101.2
Risk note: Put premium is the insurance cost; downside is floored near the put strike.
Payoff chart (Mermaid):
Entry / exit map (Mermaid):

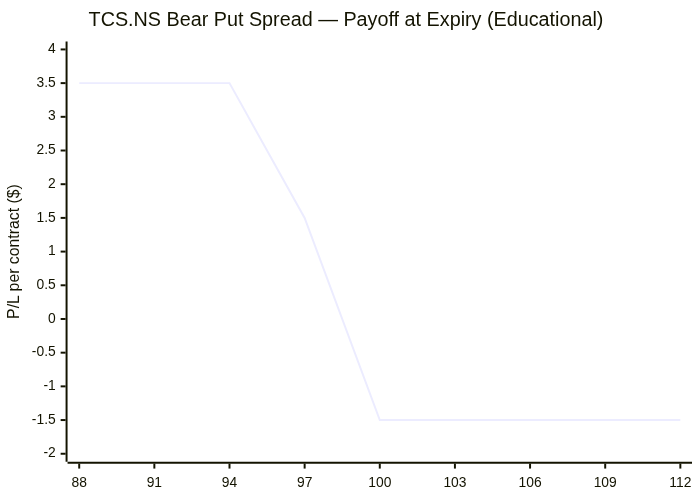
TCS.NS: Bear Put Spread
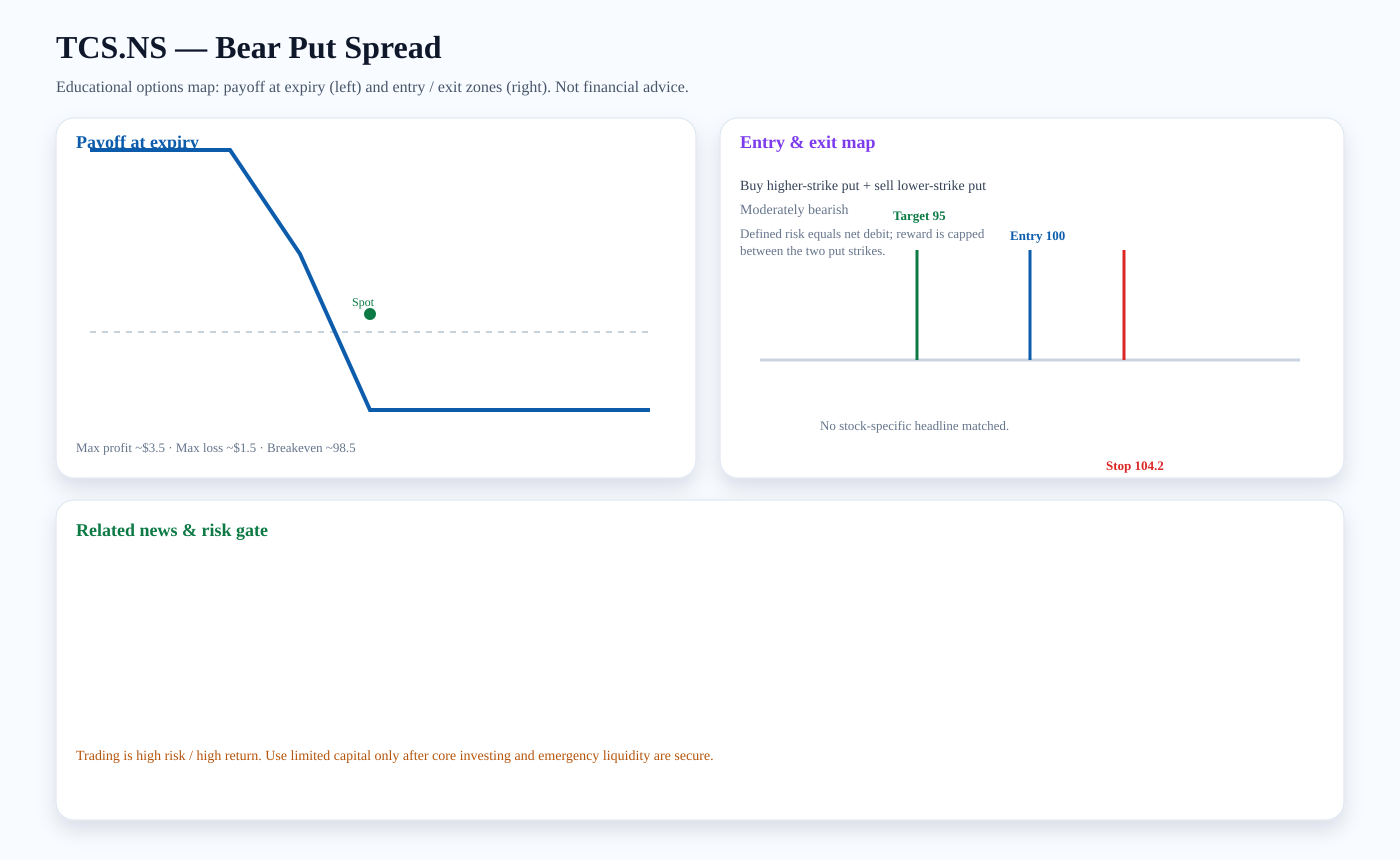
Structure: Buy higher-strike put + sell lower-strike put
Outlook: Moderately bearish
Entry zone: ~100 · Target: ~95 · Stop: ~104.2 · Breakeven: ~98.5
Risk note: Defined risk equals net debit; reward is capped between the two put strikes.
Payoff chart (Mermaid):
Entry / exit map (Mermaid):

INFY.NS: Protective / Married Put
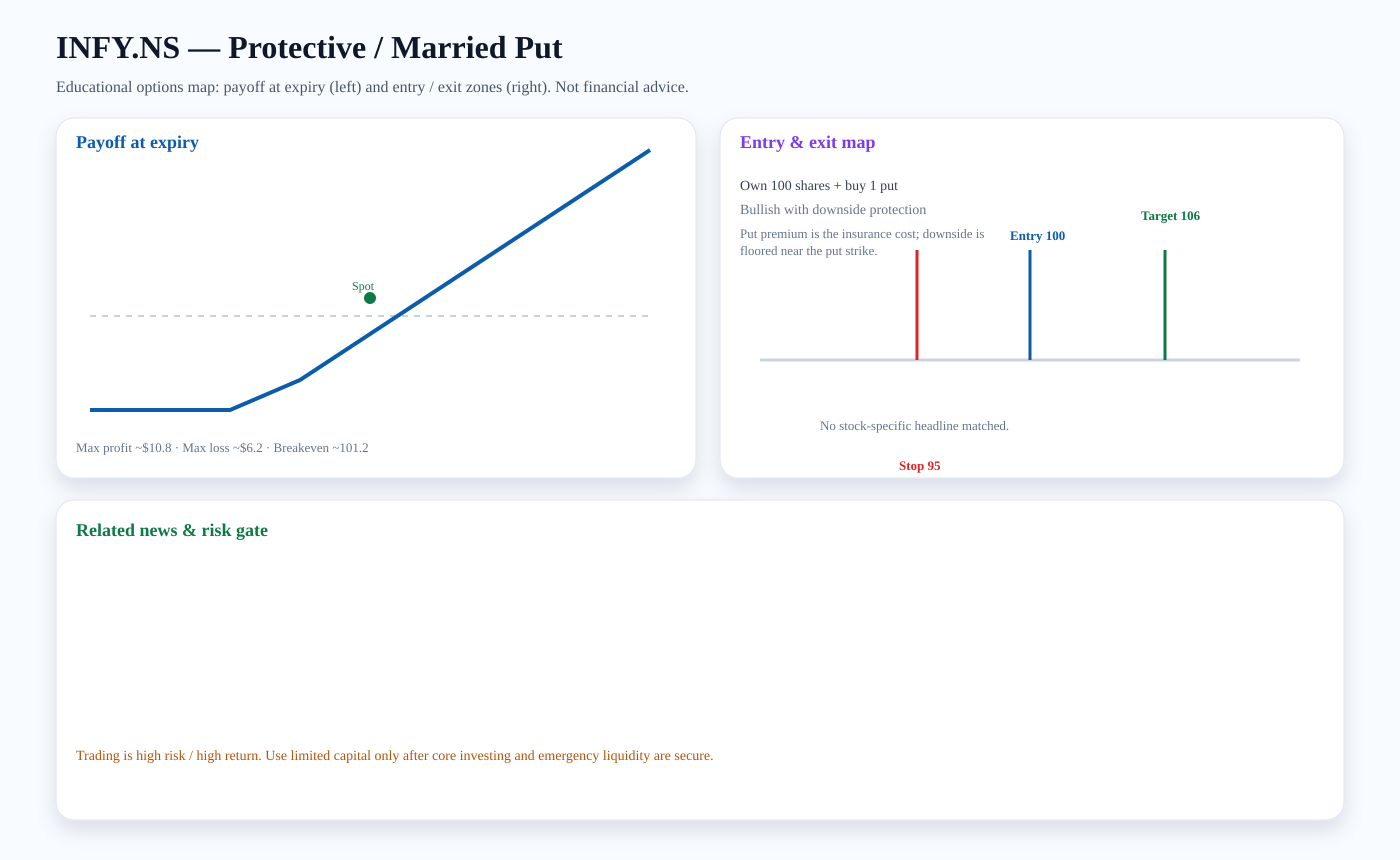
Structure: Own 100 shares + buy 1 put
Outlook: Bullish with downside protection
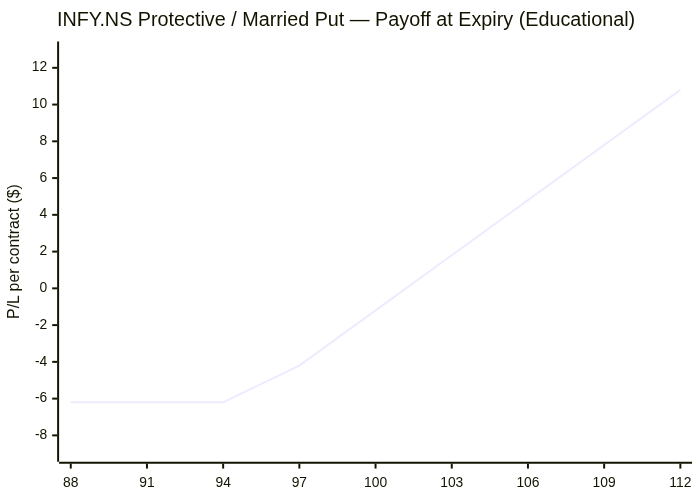
Entry zone: ~100 · Target: ~106 · Stop: ~95 · Breakeven: ~101.2
Risk note: Put premium is the insurance cost; downside is floored near the put strike.
Payoff chart (Mermaid):
Entry / exit map (Mermaid):

HDFCBANK.NS: Protective / Married Put
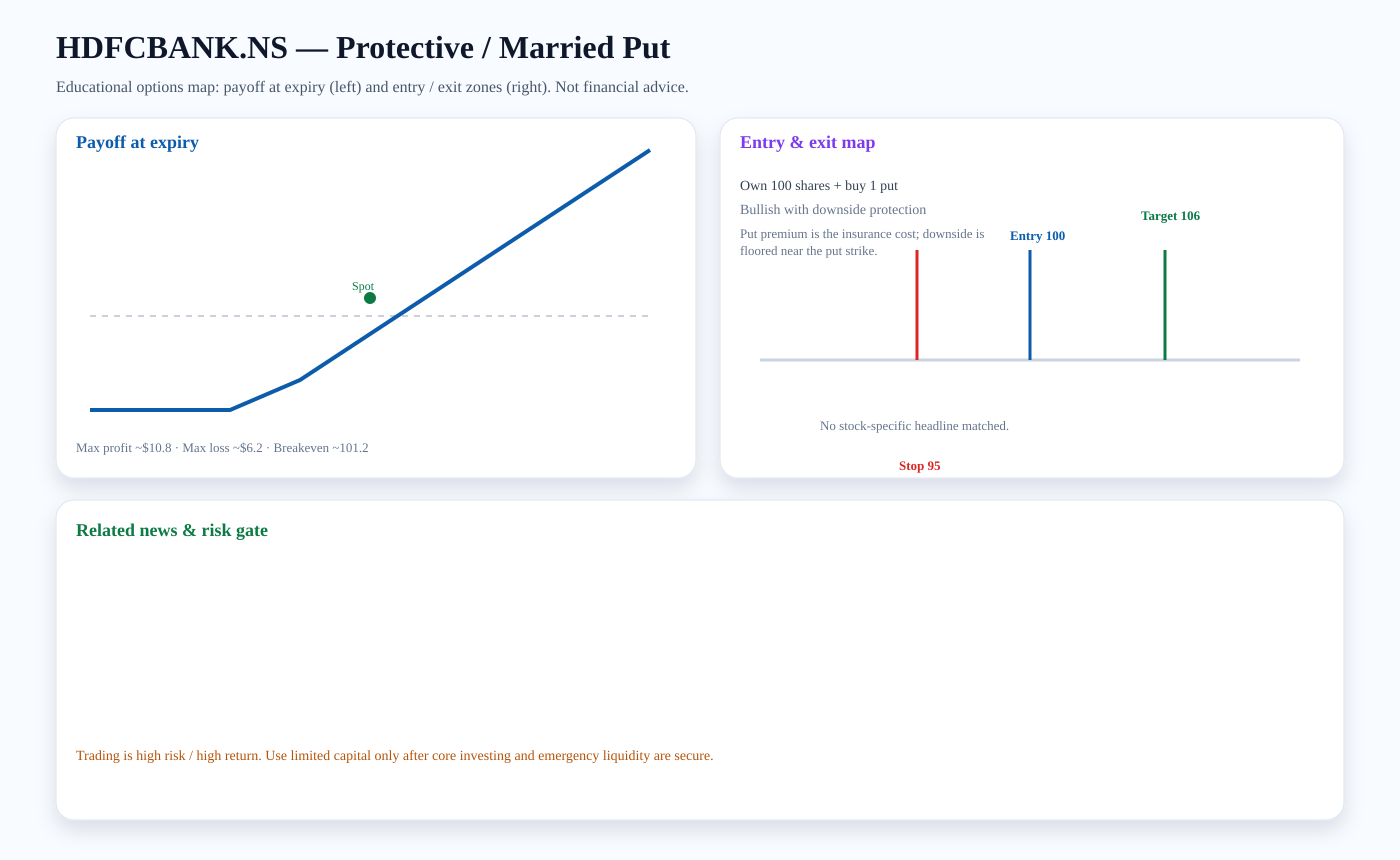
Structure: Own 100 shares + buy 1 put
Outlook: Bullish with downside protection
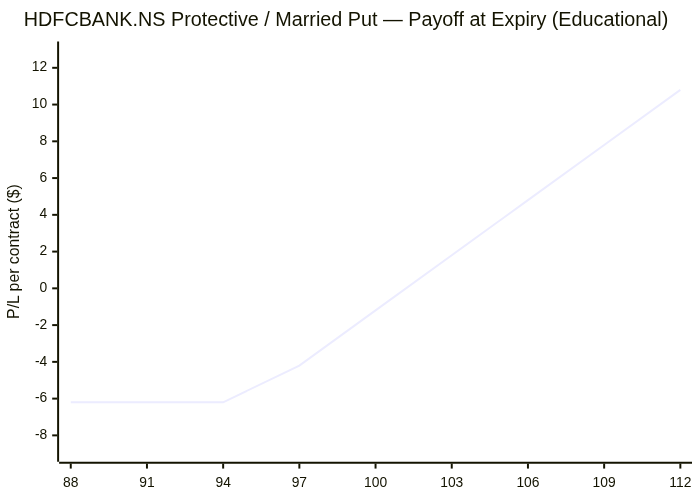
Entry zone: ~100 · Target: ~106 · Stop: ~95 · Breakeven: ~101.2
Risk note: Put premium is the insurance cost; downside is floored near the put strike.
Payoff chart (Mermaid):
Entry / exit map (Mermaid):

Trading versus investing
Investing focuses on durable ownership, diversification, and compounding. Trading seeks faster tactical returns and carries higher risk. We treat options trading as limited-capital, educational analysis only after core investment capital and emergency liquidity are protected.
PDF report — Premium
Premium members get the full PDF attached to email briefs and can download it here. Upgrade for just $2 a month.
Subscribe for $2/month