
US Market Intelligence Brief
Report as-of (US/Eastern): 2026-07-21 09:31:31 EDT
Executive summary
Report as-of (US/Eastern): 2026-07-21 09:31:31 EDT
The US market is showing mixed signals with chip stocks rebounding while industrial and energy names face pressure. 3M (MMM) leads gainers with an explosive +8.6% move, while Danaher (DHR) suffers a brutal -16.9% decline. Adobe (ADBE) drops -3.7% despite strong monthly momentum, and Halliburton (HAL) continues energy sector weakness with a -5.0% decline. The trending names reflect sector rotation dynamics, with investors favoring industrial recovery stories while rotating out of high-multiple tech and energy services.
Market regime check
Market indices are positioned for gains with chip stocks rebounding, though specific ETF data is limited in current dataset. The trending names suggest a risk-on rotation into cyclical industrials (MMM up 8.6%) while growth tech faces headwinds (ADBE down 3.7%). Energy sector weakness persists (HAL down 5.0%), indicating continued pressure on commodity-linked names. The large-mid cap focus of trending names (MMM, ADBE, SCHW, DHR) suggests institutional money is rotating within established names rather than chasing speculative plays.
Why these names are trending
Search momentum drivers:
- MMM: Explosive +8.6% daily move with strong weekly (+10.5%) and monthly (+7.8%) trends suggesting material catalyst
- DHR: Massive -16.9% decline creating high search volume as investors seek explanations for the healthcare/life sciences selloff
- ADBE: Despite -3.7% today, maintains strong monthly momentum (+15.8%) creating confusion among holders
- SCHW: Financial sector rotation play with solid monthly gains (+11.6%) despite flat daily performance
- HAL: Energy sector weakness continuing with -5.8% weekly decline amplifying search interest
The trending mix reflects sector rotation anxiety as investors navigate between growth tech, cyclical industrials, and commodity exposure.
Key news drivers
Chip sector rebound is the primary macro theme, with markets set to rise as semiconductor names recover from recent weakness. Adobe's decline is attributed to broader market weakness affecting the stock more than peers, though some Wall Street analysts see 31% upside potential. AI cloud demand remains a key theme with companies like IREN securing $2.8B in contracts, supporting the broader tech infrastructure narrative.
Geopolitical risks around US-Iran tensions and oil volatility are creating headwinds for energy names like Halliburton. The 10-day cease-fire push by mediators is helping oil prices decline, further pressuring energy services stocks.
Durable momentum ideas
MMM (3M Company) – Primary pick
- Catalyst: +8.6% gap suggests material positive development (likely earnings beat or guidance raise)
- Momentum: Weekly +10.5%, Monthly +7.8% shows sustained institutional accumulation
- Durability: Industrial recovery theme with defensive characteristics; high dividend yield provides downside support
SCHW (Charles Schwab) – Financial sector play
- Catalyst: +11.6% monthly gain reflects interest rate environment benefits and market share gains
- Momentum: Consistent weekly (+1.2%) and monthly trends suggest steady institutional flows
- Durability: Rising rate environment benefits; increased trading volumes support revenue growth
Contrarian consideration: ADBE – Strong monthly momentum (+15.8%) despite today's weakness suggests institutional support remains intact.
Options / structure ideas
*This is educational content and not financial advice. Options involve substantial risk and may not be suitable for all investors.*
MMM – Primary: CALL structures
- Call-side: Buy 172.5C/Sell 175C debit spread (2026-07-24) – stock already above 172.5 provides immediate delta
- Put-side: Cash-secured puts at 170 strike for entry on any momentum pause
- Risk: Poor liquidity ($0.00 bid/ask spreads) and 3-day expiry create execution challenges
DHR – Primary: PUT structures
- Put-side: 165P/160P debit spread targeting continued weakness from -16.9% decline
- Call-side: Covered calls at 170-175 strikes if holding shares through volatility
- Risk: Unknown catalyst behind decline could reverse; oversold bounce potential
ADBE – Primary: PUT structures
- Put-side: 225P/220P debit spread on gap-down weakness despite strong monthly trend
- Call-side: Covered calls at 230+ strikes for existing holders
- Risk: Strong monthly momentum (+15.8%) could provide support
SCHW – Primary: CALL structures
- Call-side: 102C/104C debit spread on financial sector momentum
- Put-side: Cash-secured puts at 100 strike for pullback entry
- Risk: 3-day expiry with poor bid/ask visibility
Risks & watch-outs
Immediate risks:
- Liquidity concerns: Multiple names showing $0.00 bid/ask spreads on options, suggesting stale quotes or poor market making
- 3-day expiry risk: 2026-07-24 options face extreme time decay acceleration
- Gap risk: MMM's 8.6% gap creates elevated assignment risk for short option positions
Macro risks:
- Geopolitical tensions: US-Iran situation could reverse energy sector dynamics quickly
- Sector rotation volatility: Current industrial/tech rotation could reverse on any growth concerns
- Earnings season: Upcoming megacap earnings could shift sentiment rapidly across trending names
Execution risks:
- Poor options liquidity across multiple trending names may result in wide spreads and difficult fills
- High implied volatility likely embedded in options following large moves, creating expensive entry points
Visual strategy maps
Payoff curves and entry/exit zones below are educational aids — not trade instructions. Confirm with your own chart, liquidity, and risk limits.
DHR: Bear Put Spread
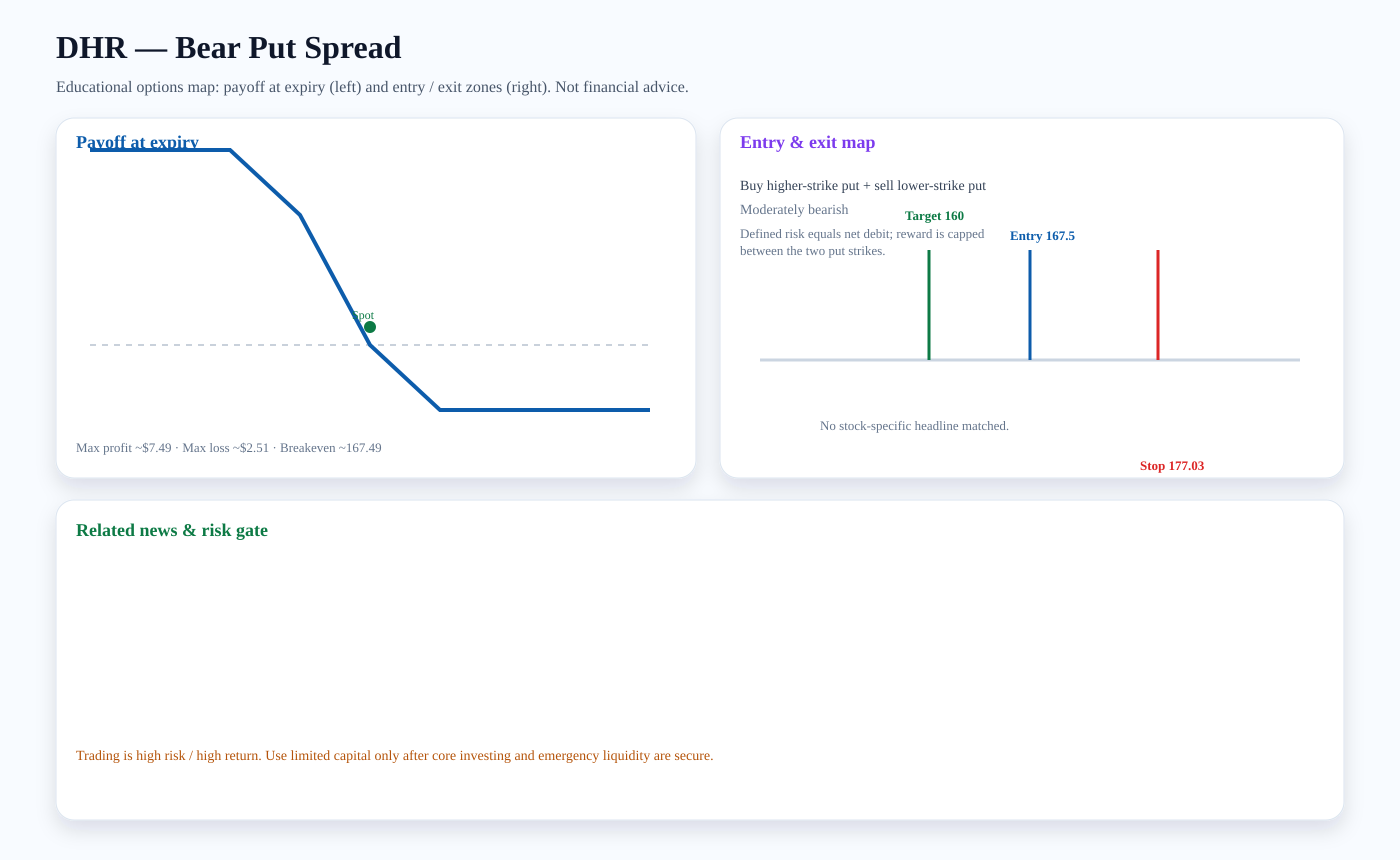
Structure: Buy higher-strike put + sell lower-strike put
Outlook: Moderately bearish
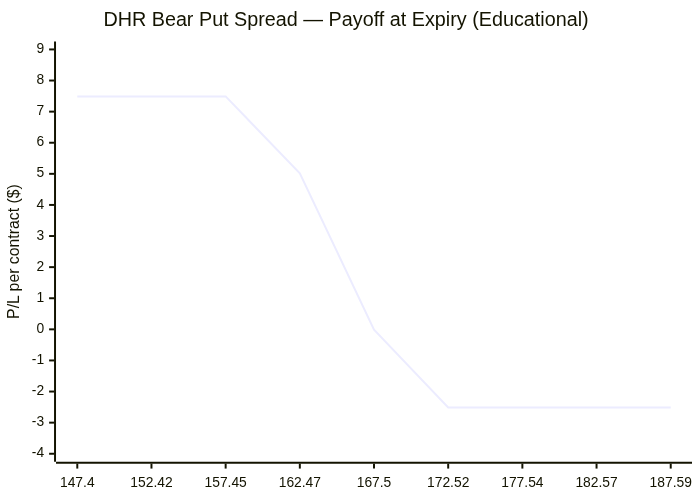
Entry zone: ~167.5 · Target: ~160 · Stop: ~177.03 · Breakeven: ~167.49
Risk note: Defined risk equals net debit; reward is capped between the two put strikes.
Payoff chart (Mermaid):
Entry / exit map (Mermaid):

ADBE: Bear Put Spread
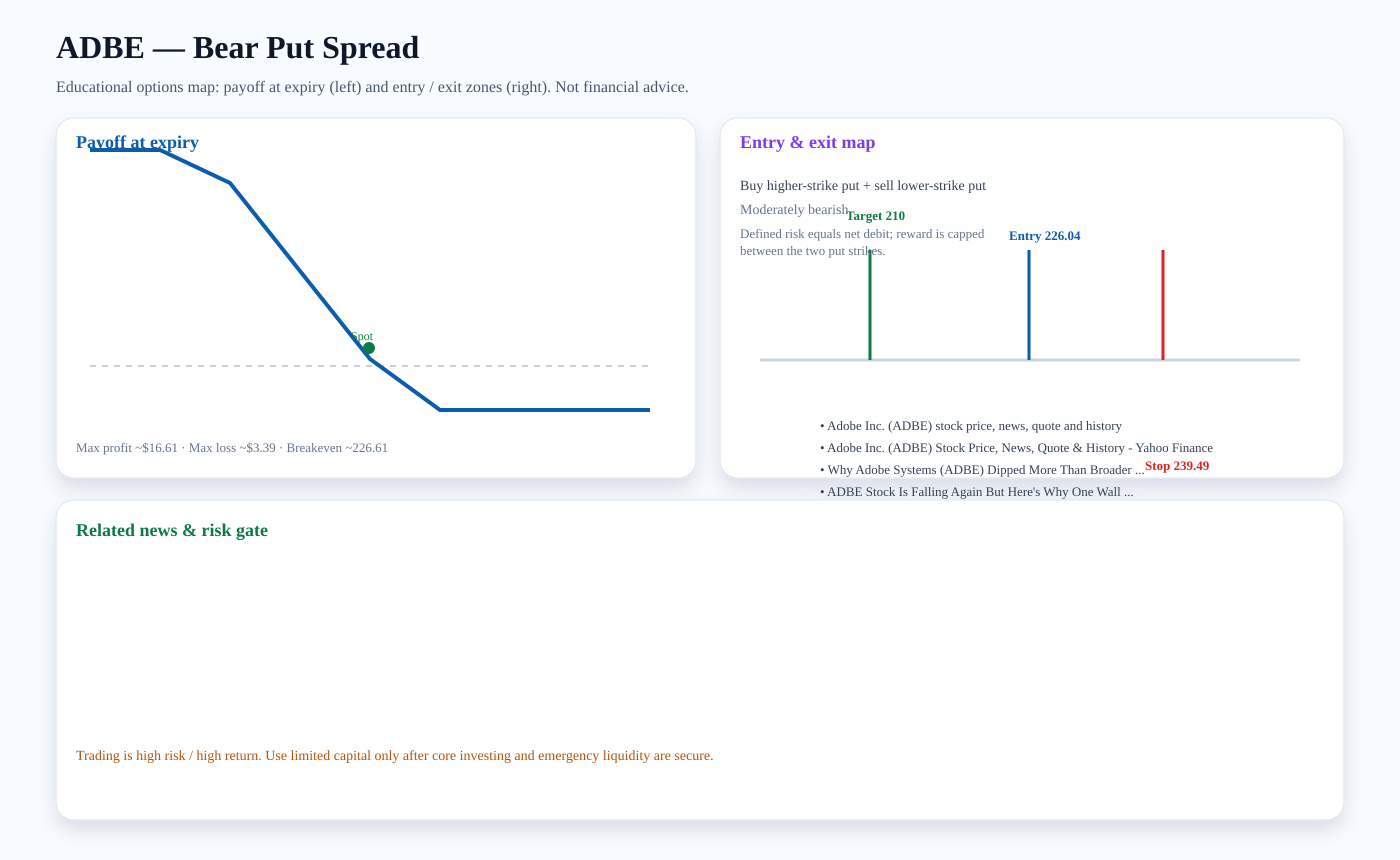
Structure: Buy higher-strike put + sell lower-strike put
Outlook: Moderately bearish
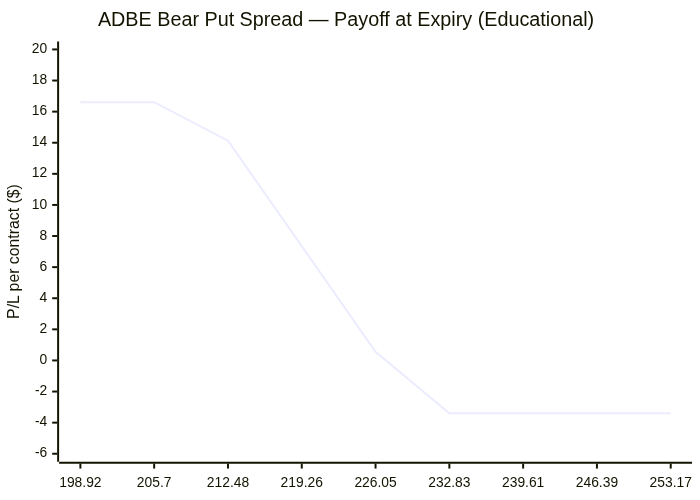
Entry zone: ~226.04 · Target: ~210 · Stop: ~239.49 · Breakeven: ~226.61
Risk note: Defined risk equals net debit; reward is capped between the two put strikes.
Related news links:
Payoff chart (Mermaid):
Entry / exit map (Mermaid):

MMM: Bull Call Spread
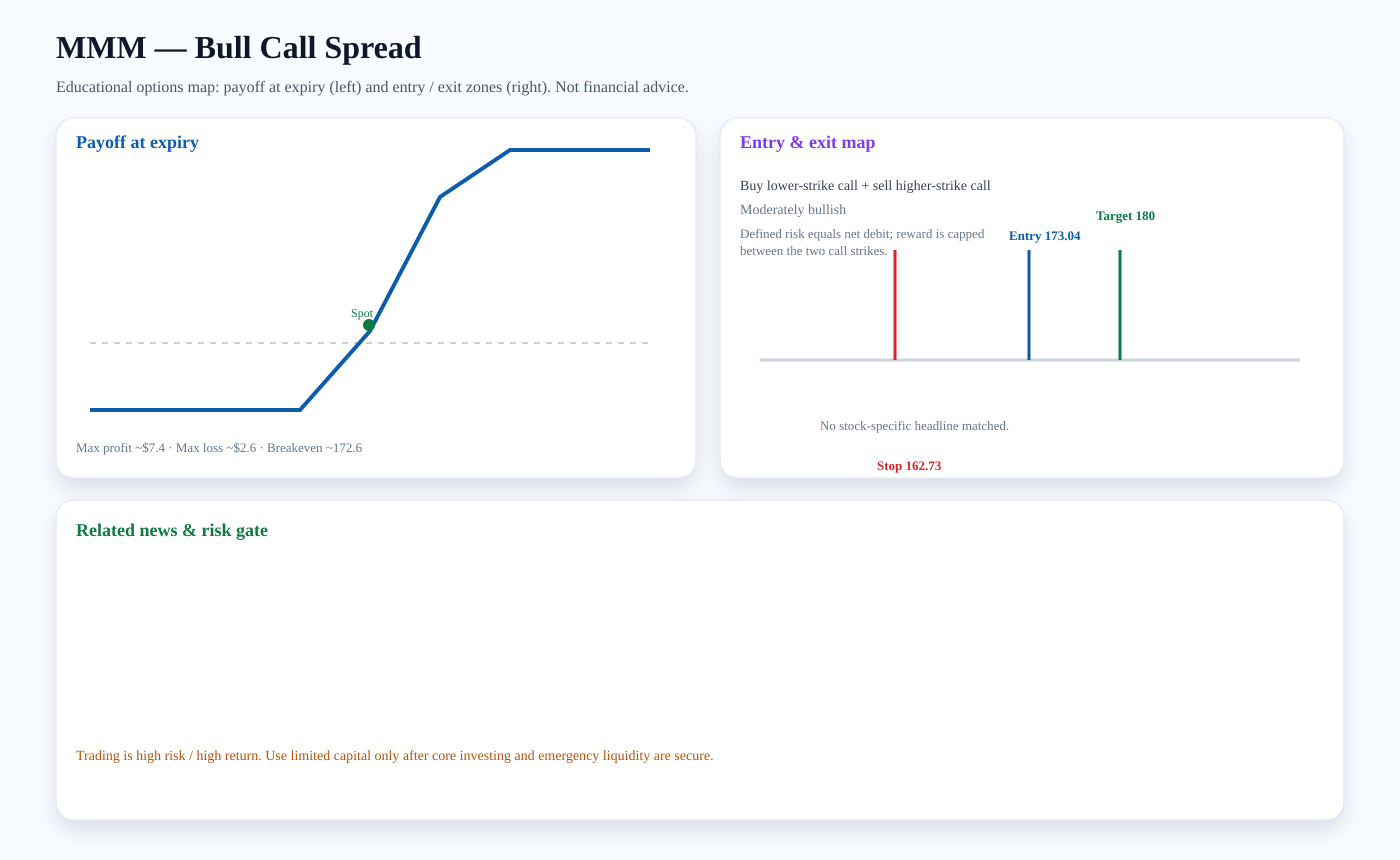
Structure: Buy lower-strike call + sell higher-strike call
Outlook: Moderately bullish
Entry zone: ~173.04 · Target: ~180 · Stop: ~162.73 · Breakeven: ~172.6
Risk note: Defined risk equals net debit; reward is capped between the two call strikes.
Payoff chart (Mermaid):
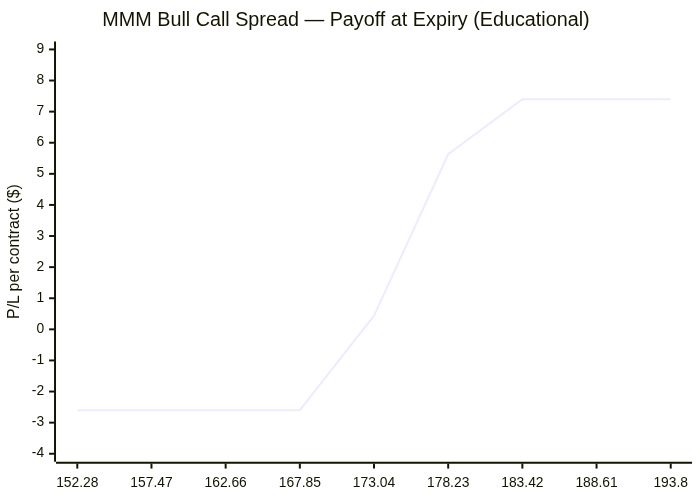
Entry / exit map (Mermaid):

SCHW: Bull Call Spread
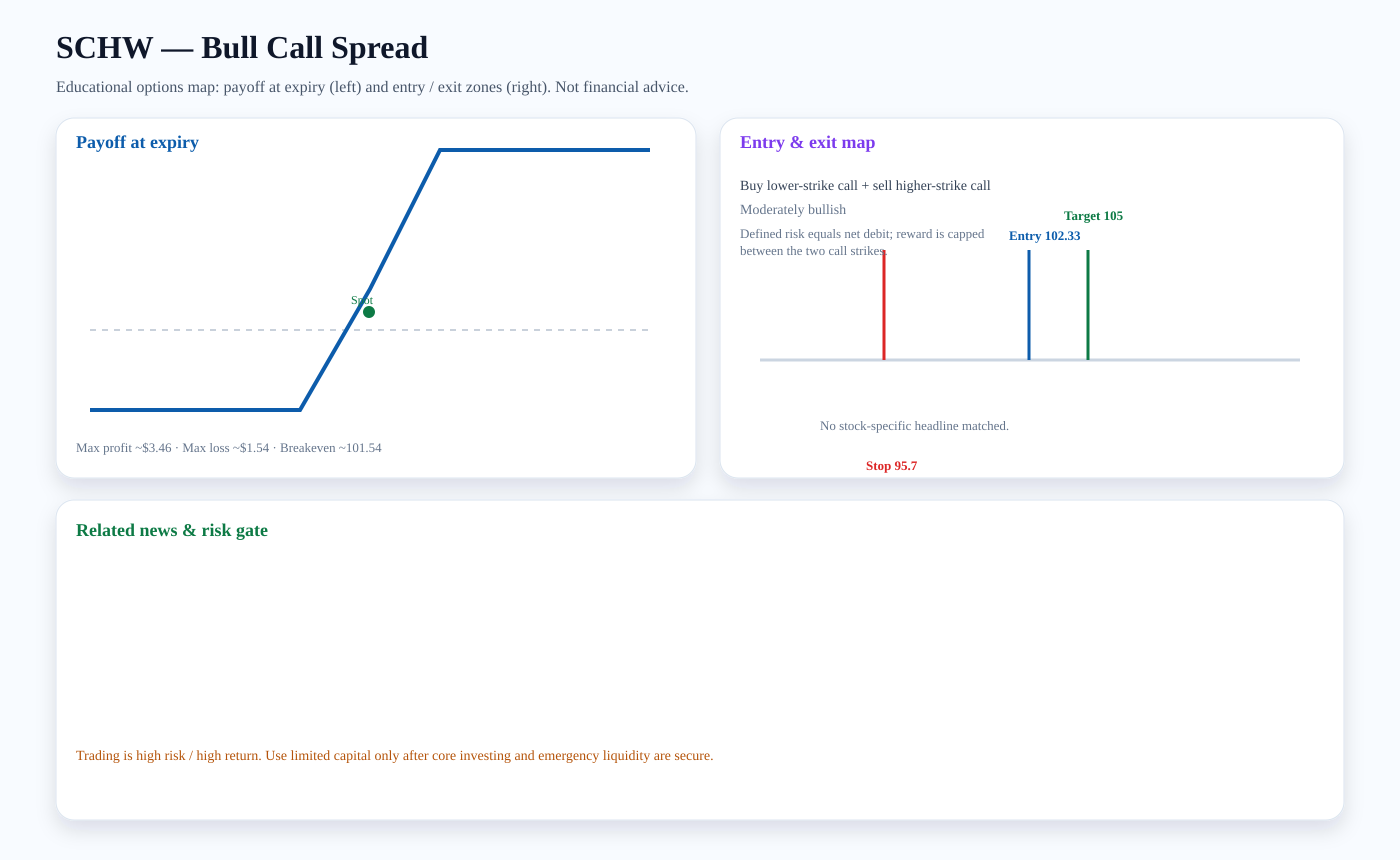
Structure: Buy lower-strike call + sell higher-strike call
Outlook: Moderately bullish
Entry zone: ~102.33 · Target: ~105 · Stop: ~95.7 · Breakeven: ~101.54
Risk note: Defined risk equals net debit; reward is capped between the two call strikes.
Payoff chart (Mermaid):
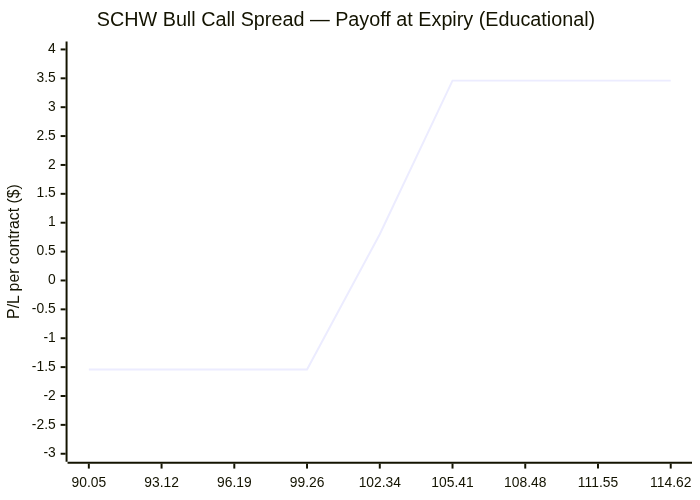
Entry / exit map (Mermaid):

Trading versus investing
Investing focuses on durable ownership, diversification, and compounding. Trading seeks faster tactical returns and carries higher risk. We treat options trading as limited-capital, educational analysis only after core investment capital and emergency liquidity are protected.
PDF report — Premium
Premium members get the full PDF attached to email briefs and can download it here. Upgrade for just $2 a month.
Subscribe for $2/month