
US Market Intelligence Brief
Report as-of (US/Eastern): 2026-07-24 09:04:27 EDT
Executive summary
As-of: 2026-07-24 09:04:27 EDT (pre-market, Friday)
- Earnings-dominated tape with extreme single-name dispersion. Downside gaps: CHTR −12.9%, AXP −6.6%, VZ −1.1%. Upside gaps: AMKR +8.7%, SAP +4.2%, SLB +2.6%. Index-level signal is secondary to single-name catalyst risk today.
- The dominant regime theme is a monthly drawdown across high-beta AI/semis/tech: ORCL −27.1%, AMKR −24.7%, SPCX −24.3%, INTC −24.2% on the month, with the SOX flagged as having entered a bear market last week (Yahoo). Today's INTC/AMKR strength is counter-trend bounce, not trend repair.
- Relative strength sits in energy services and defensives: SLB is green on results with a flat 1w/1m base — the cleanest chart in the capture.
- Data quality warning: all captured options chains show 0.00/0.00 bid/ask with corrupted IV fields. Nothing below is executable as quoted — everything must be re-priced after 09:30 ET.
Market regime check (S&P 500 + sector/thematic ETFs)
No index or thematic ETFs (SPY/QQQ, semis, Taiwan, oil, gold) were captured in this run — regime is inferred from stock-level breadth and news:
| Signal | Read |
|—|—|
| Mega-cap tech monthly moves (ORCL −27%, SPCX −24%) | De-risking / multiple compression in AI-adjacent growth |
| SOX in a bear market (per Yahoo headline); INTC, AMKR −24%/+25% monthly | Semiconductor complex under structural pressure; bounces are violent but counter-trend |
| Defensives mixed: VZ −4.6% month but only −1% today; AXP −6.6% on results | Rotation toward low-beta is partial; earnings risk overrides factor logic |
| SAP trims 2026 profit goal on AI-investment costs; EU fines Google $1B | AI capex is now a margin headwind narrative; regulatory overhang on mega-cap tech |
| SLB +2.6% on results, 1w +0.3% / 1m −1.2% | Energy services acting as a relative-strength pocket |
Regime call: high-dispersion, risk-off-within-growth market. Earnings gaps (both directions) are the tradable unit; index trend is not the driver today.
Why these names are trending
- INTC — Q2 print out: sales surged 25% (WSJ); AI/datacenter adoption driving an "improving outlook" (Yahoo). +3.35% on the week, still −24.2% on the month. Highest volume in the capture (128.5M) — the day's focal liquidity.
- AMKR — +8.68% pre-market gap on no captured headline; pattern consistent with an earnings-type catalyst. Weekly turning (+3.7%) against a −24.7% month.
- SAP — Q2 cloud backlog +26% to ~€23B, cloud revenue +24%, but 2026 profit goal trimmed on AI costs. +4.2% pre-market is a relief bounce off a 2-year closing low (−9.4% week).
- AXP / VZ / CHTR / SLB — classic Friday earnings cluster. CHTR −12.9% (miss), AXP −6.6% (miss/guide-down pattern), VZ −1.1% (muted), SLB +2.6% (beat).
- ORCL / SPCX — trending on price action alone: monthly crashes of −27% and −24% draw attention; no fresh captured catalyst. SPCX up modestly (+1.4%) on lighter-than-average volume.
- WLDS — no quote or news in capture; unverified, excluded from ideas.
Key news drivers
- INTC: "Intel Shares Jump as Sales Surge 25% in Second Quarter" (WSJ); "Intel rises as strong forecasts signal AI boost for turnaround" (Yahoo). One headline still references reporting "after the bell Thursday" — confirm the print is fully digested before treating event risk as cleared.
- SAP: Q2 2026 beat on cloud metrics; 2026 profit goal trimmed (Reuters, Jul 23); CFO pushing "AI beyond chatbot low-hanging fruit" (~15h ago) — narrative management around the guidance cut.
- Semis macro: SOX entered a bear market last week (Yahoo) — context for every semi bounce today.
- Off-target but macro-relevant curated items: EU fines Google $1B (regulatory), Nvidia pushing to own data-center silicon (competitive pressure on INTC/AMKR complex), China open AI models challenging US playbook.
Durable momentum ideas (mid/high-cap focus)
| Rank | Name | Setup | Why momentum may sustain | Key invalidation |
|—|—|—|—|—|
| 1 | SLB | +2.6% on results; 1w +0.3% / 1m −1.2% | Earnings-backed move on an undamaged base — the only name in the capture not fighting a downtrend. Energy services cash-flow story with relative strength vs a crushed tape. Energy exposure (oil-proxy) adds diversification vs the AI complex. | Failure to hold ~$47.50 (pre-gap area) on regular-hours volume |
| 2 | INTC | Catalyst-confirmed bounce: Q2 sales +25%, AI outlook improving; 128M volume | Real, verifiable catalyst + mega liquidity + short-interest fuel after a −24% month. Sustains if guidance narrative holds and SOX stabilizes. | Rejection at ~$105 / loss of $100; SOX making new lows |
| 3 | AMKR | +8.7% gap; weekly +3.7% | OSAT/advanced-packaging leverage to the AI semi build-out; gap reclaims a chunk of the monthly damage. Sustains only if ~$70–72 holds on regular-hours volume. | Gap fill back under $68; catalyst turning out to be already-priced |
| Watch | SAP | +4.2% relief gap at 2-year lows | Backlog/cloud numbers are genuinely strong; bounce could extend to 160+ — but the profit-goal cut caps the story. Counter-trend; not a core momentum hold. | Stall/reject below $155 at the open |
Avoid as momentum: CHTR (catch-the-falling-knife, −13% gap), AXP (post-miss downtrend risk), SPCX/ORCL downside (already extended −24–27% — poor reward/risk to chase).
Options / structure ideas
*Educational market commentary only — not financial advice or a recommendation to trade. All captured chains show 0.00/0.00 bid/ask, corrupted IVs, and last-trade stamps from 2026-07-23. Re-price everything off live quotes after 09:30 ET; use limit orders at mid only.*
| Name | Primary side | Primary structure | Opposite-side (lower conviction) | Tenor |
|—|—|—|—|—|
| INTC | CALL | 103/108 call debit spread (bounce continuation, defined risk, dampens IV crush) | Cash-secured 100P (own the flush); 103/98 put spread for downtrend bears | 2026-07-31 |
| AMKR | CALL | 70/75 call debit spread (ride gap continuation into a monthly downtrend without naked premium) | 65/60 put debit spread as gap-fade hedge; CSP 60–65 to monetize elevated IV; covered call at 80 for holders | 2026-08-21 |
| SAP | CALL | 155/160 call debit spread, target debit ≤ ~$2.00–2.25 (gap continuation; capped loss if bounce dies at 155) | 150/145 put spread only on a stall below 155; covered call 160/165 overwrite for existing holders | 2026-07-31 |
| ORCL | PUT | 122/117 put debit spread (trend + pre-market weakness alignment; conservative alt 120/115) | Covered call at 127/130 for holders (127 = resistance at prior close); call spreads are counter-trend — small or skip | 2026-07-31 |
| SPCX | PUT | 117/110 put debit spread (fade-the-bounce / continuation; target debit ≤ ~50% of width) | 117/122 call spread as a small bounce trade; covered ~125C for holders; protective 115P | 2026-07-31 |
Liquidity/execution notes: INTC calls show workable interest (OI ~1,196); AMKR 75C OI 2,096 is the best anchor but the name is not top-tier options liquidity — expect wide markets early. SAP put books are thin (155P: 16 vol / 30 OI) — use 150P instead. ORCL/SPCX usable OI but all marks are stale; let the opening rotation set real prices. 7-DTE spreads (INTC, SAP, ORCL, SPCX) need the move within 1–2 sessions or theta erodes the debit.
Risks & watch-outs
- Stale/broken market data: zero bid/ask and junk IVs across every captured chain; INTC's news feed shows a 2-yr average close of 39.64 vs spot ~102 — validate the tape and the instrument (SPCX listed as a tradable equity is unusual) before acting.
- Counter-trend exposure: every upside idea (INTC, AMKR, SAP) is a bounce inside a −24–27% monthly drawdown with the SOX in a bear market. Failed gaps in damaged charts retrace fast.
- Post-earnings IV crush: INTC/AMKR/SAP long-premium structures are vulnerable now that catalysts are out; spreads mitigate but don't eliminate.
- Earnings gap tails: CHTR −13% and AXP −6.6% demonstrate current gap severity; position sizing should assume gap-through-stop risk.
- Headline vacuum: no captured driver for AMKR, ORCL, SPCX, CHTR, AXP moves — confirm catalysts before entry; two-way gap risk.
- SAP-specific: profit-goal cut + ADR structure (EU session/FX) adds layers of uncertainty to a counter-trend bounce.
- Theta/gamma: 2026-07-31 structures are 7 DTE — time is working against long debit spreads from the first tick.
*This report is educational market commentary, not financial advice.*
Visual strategy maps
Payoff curves and entry/exit zones below are educational aids — not trade instructions. Confirm with your own chart, liquidity, and risk limits.
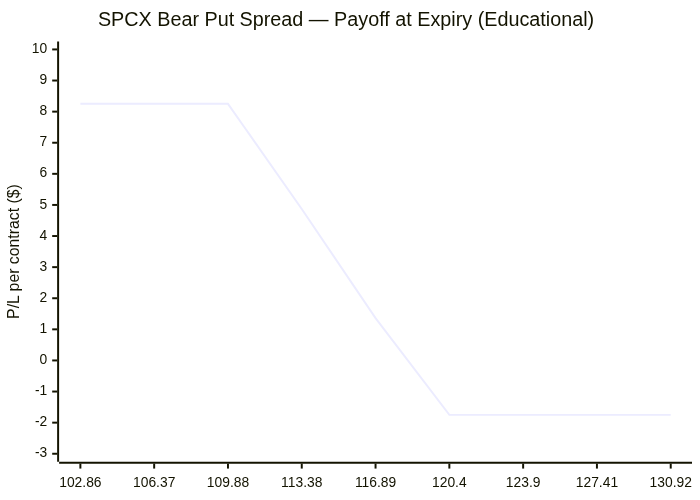
SPCX: Bear Put Spread
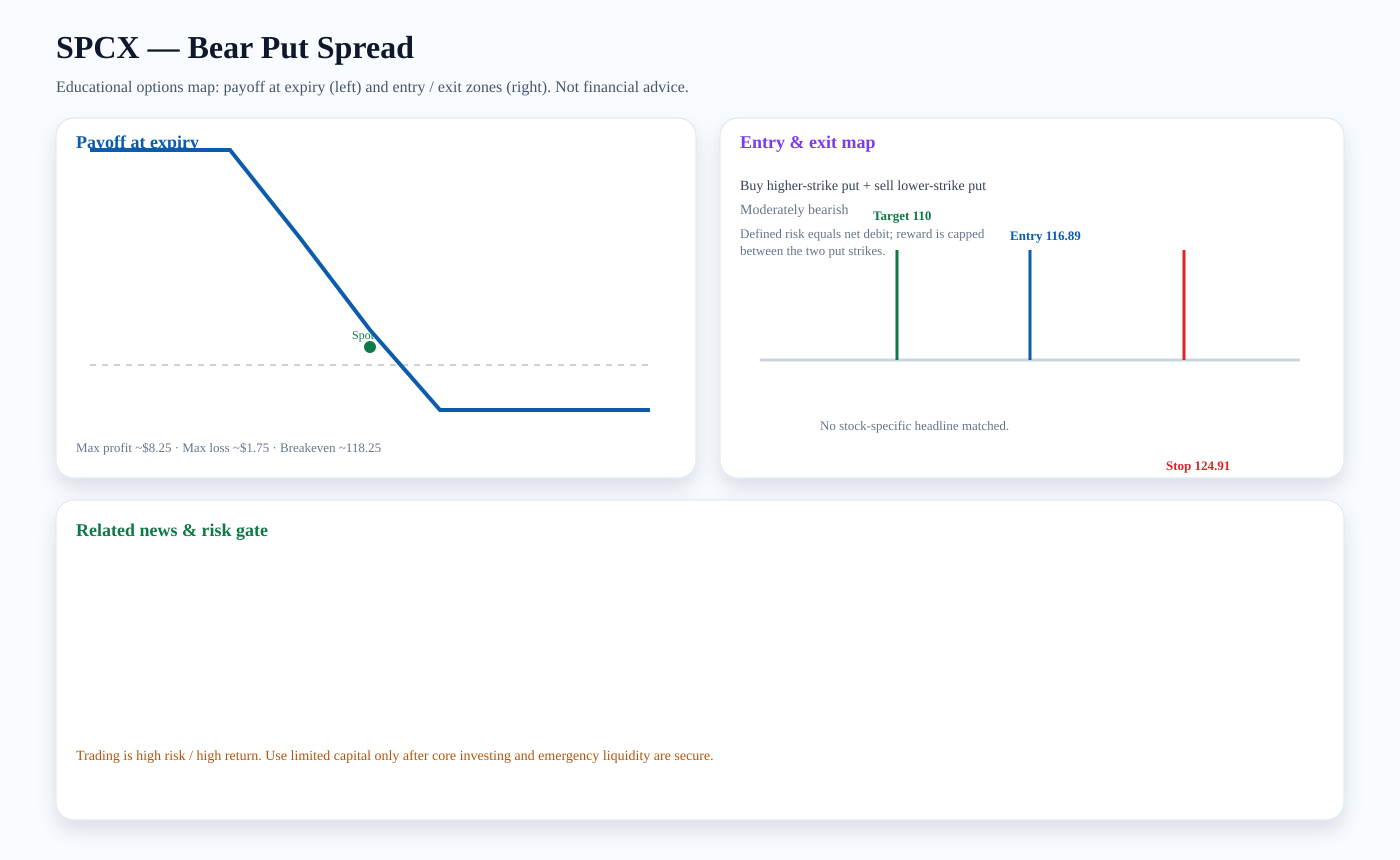
Structure: Buy higher-strike put + sell lower-strike put
Outlook: Moderately bearish
Entry zone: ~116.89 · Target: ~110 · Stop: ~124.91 · Breakeven: ~118.25
Risk note: Defined risk equals net debit; reward is capped between the two put strikes.
Payoff chart (Mermaid):
Entry / exit map (Mermaid):

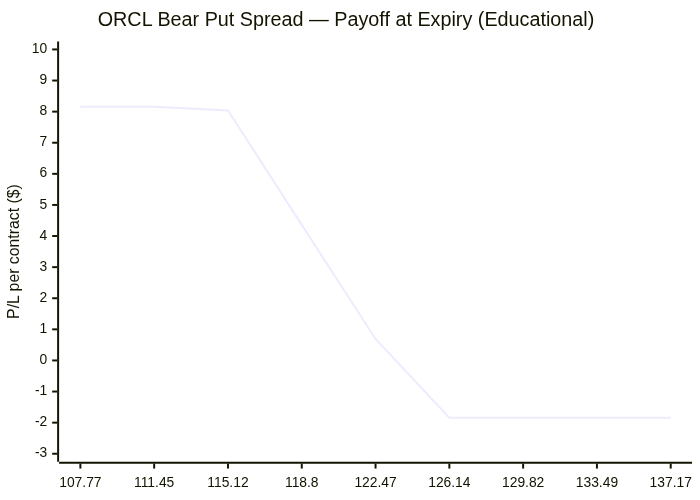
ORCL: Bear Put Spread
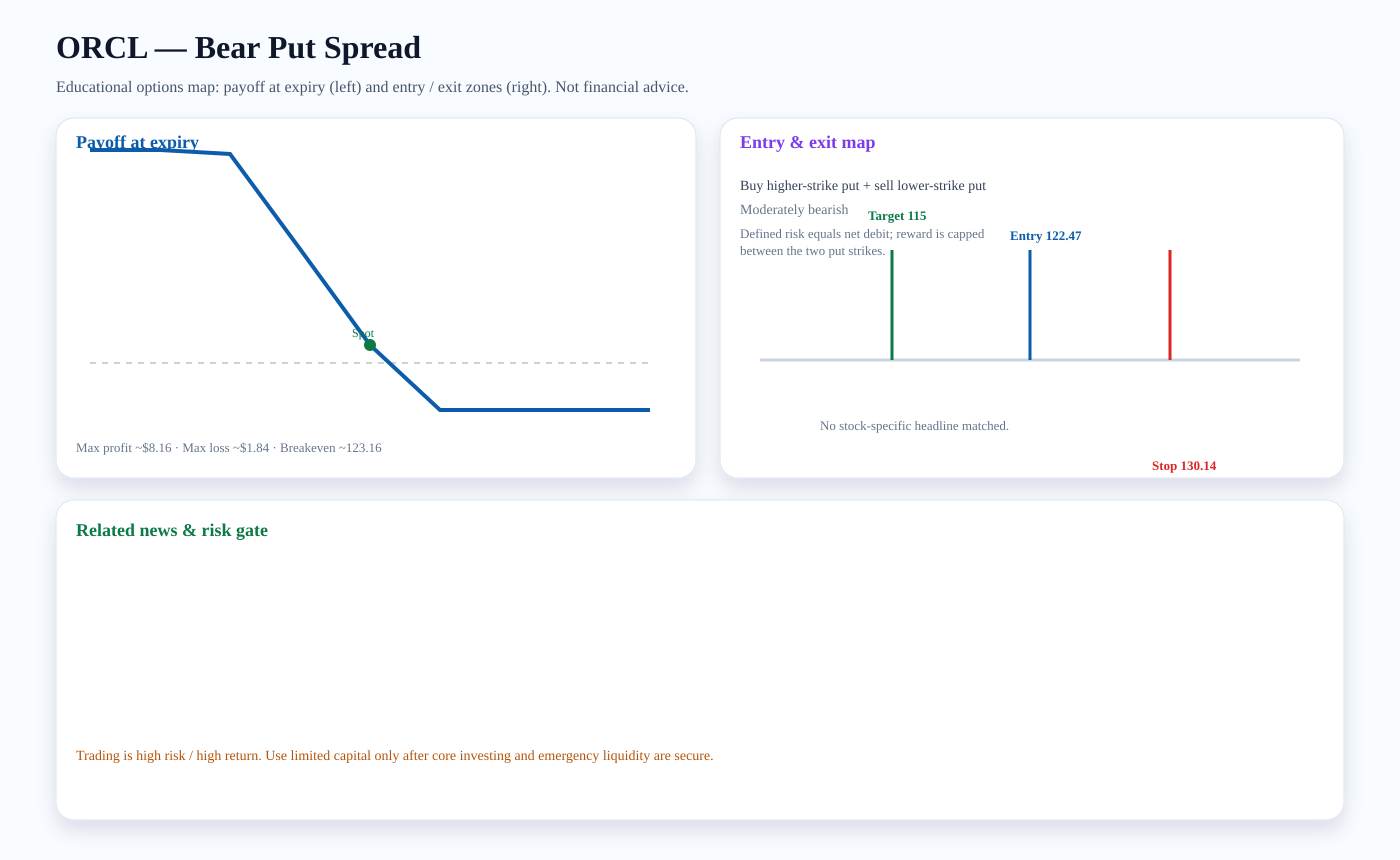
Structure: Buy higher-strike put + sell lower-strike put
Outlook: Moderately bearish
Entry zone: ~122.47 · Target: ~115 · Stop: ~130.14 · Breakeven: ~123.16
Risk note: Defined risk equals net debit; reward is capped between the two put strikes.
Payoff chart (Mermaid):
Entry / exit map (Mermaid):

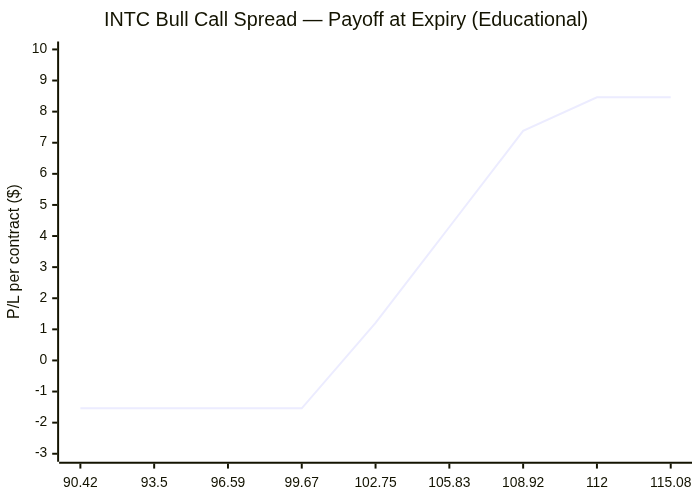
INTC: Bull Call Spread
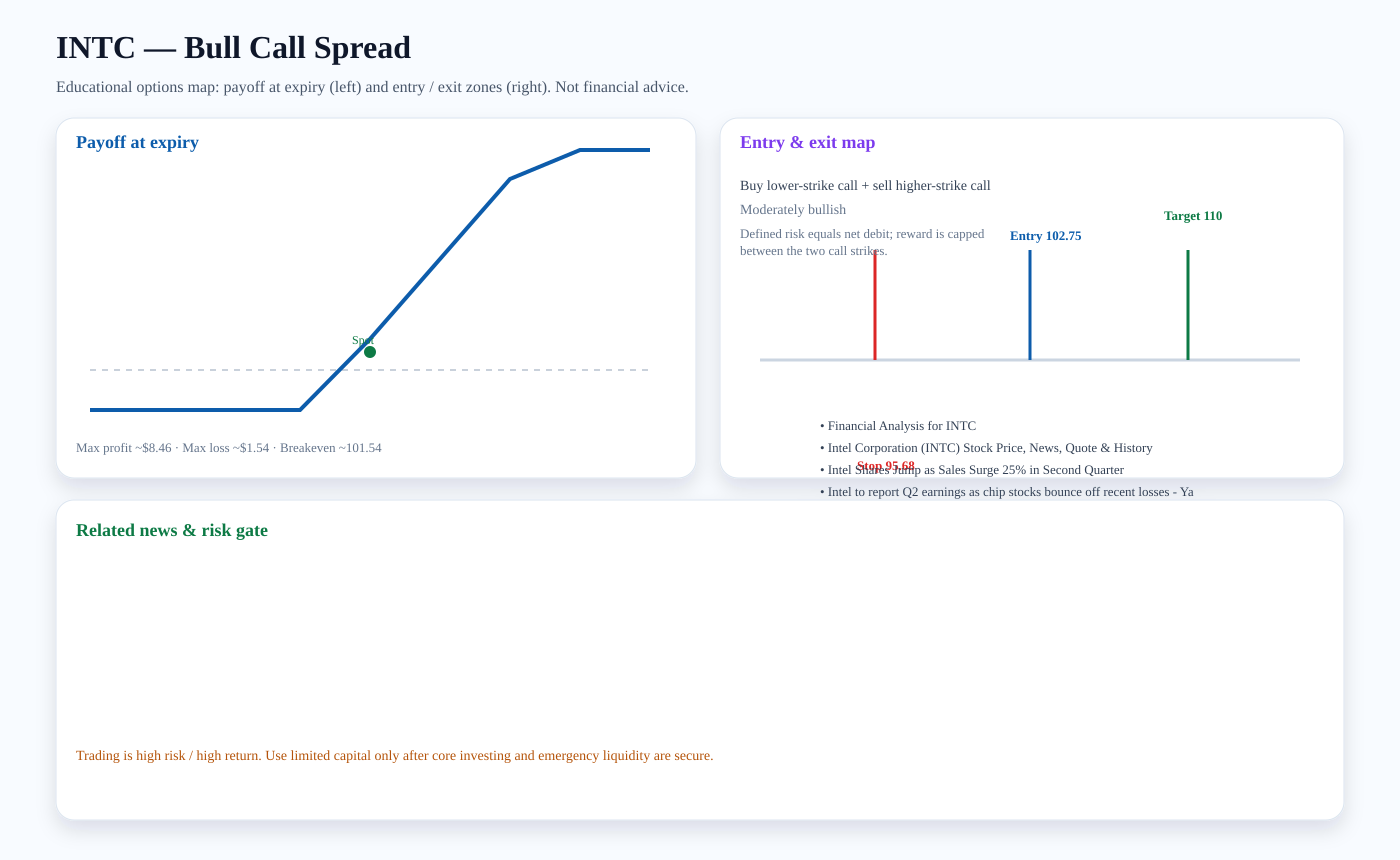
Structure: Buy lower-strike call + sell higher-strike call
Outlook: Moderately bullish
Entry zone: ~102.75 · Target: ~110 · Stop: ~95.68 · Breakeven: ~101.54
Risk note: Defined risk equals net debit; reward is capped between the two call strikes.
Related news links:
Payoff chart (Mermaid):
Entry / exit map (Mermaid):

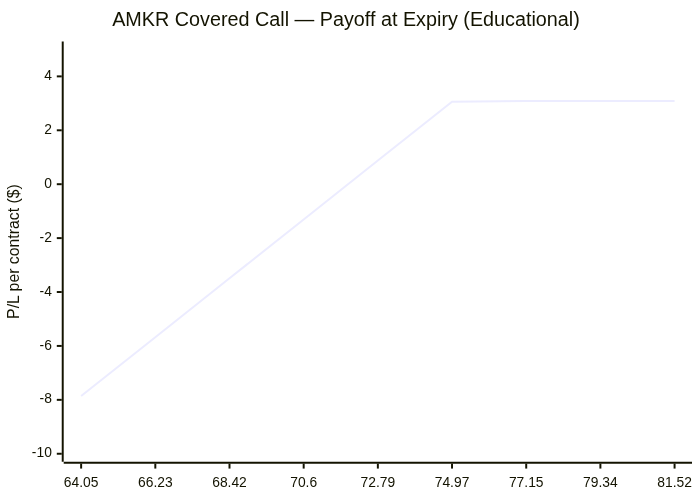
AMKR: Covered Call
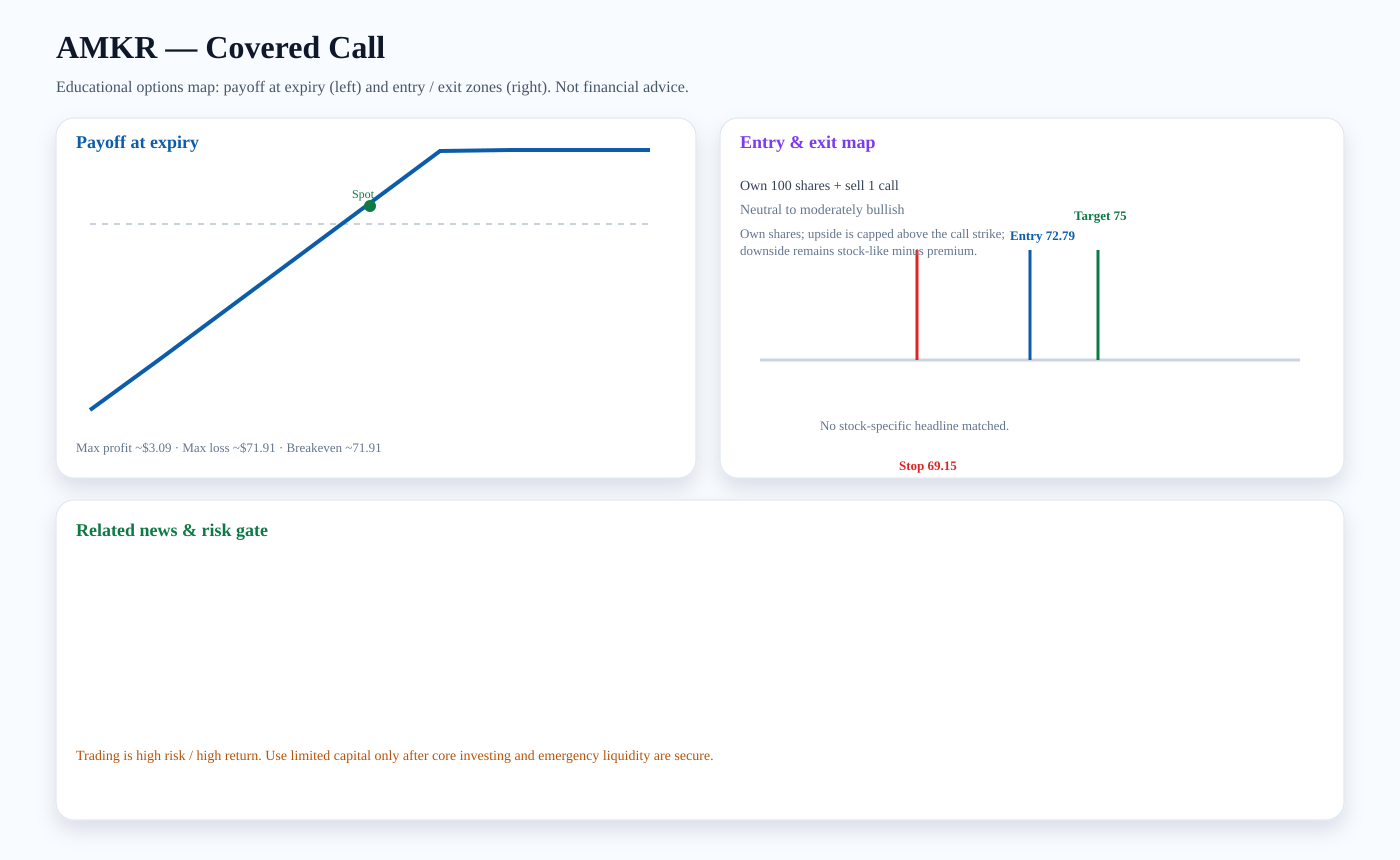
Structure: Own 100 shares + sell 1 call
Outlook: Neutral to moderately bullish
Entry zone: ~72.79 · Target: ~75 · Stop: ~69.15 · Breakeven: ~71.91
Risk note: Own shares; upside is capped above the call strike; downside remains stock-like minus premium.
Payoff chart (Mermaid):
Entry / exit map (Mermaid):

Trading versus investing
Investing focuses on durable ownership, diversification, and compounding. Trading seeks faster tactical returns and carries higher risk. We treat options trading as limited-capital, educational analysis only after core investment capital and emergency liquidity are protected.
PDF report — Premium
Premium members get the full PDF attached to email briefs and can download it here. Upgrade for just $2 a month.
Subscribe for $2/month