
India (NSE) Market Intelligence Brief
Report as-of (US/Eastern): 2026-10-04 23:18:07 EDT
Data sources: NSE pre-open F&O and NSE derivatives quotes
Executive summary
As-of: 2026-10-04 23:18:07 EDT = Mon 05-Oct-2026 ~08:48 IST — NSE pre-open window ahead of Monday's session.
Sources: NSE pre-open F&O page; NSE official derivatives quote pages (nseindia.com/get-quote/derivatives/…). Note: index trend fetch and pre-open movers fetch returned no data; the F&O option-chain fetch timed out, so all options levels below are indicative, not live quotes.
Tape is mixed-large-cap: IT leading (INFY +4.11%, TCS +1.19%), banks firm (HDFCBANK +1.76%), defensives/energy soft (HINDUNILVR −2.29%, RELIANCE −1.63%). Two of the five names (INFY, HDFCBANK) are counter-trend bounces against negative weekly or monthly trends; HUL and RELIANCE are aligned downtrends. Q2 earnings season opens mid-October — event risk sits inside the October monthly expiry for most of these names.
Index & F&O pre-open regime
- NIFTY / BANKNIFTY / MIDCPNIFTY: *No official NSE index trend data retrieved in this capture.* Regime read is therefore inferred from the F&O pre-open snapshot only — treat as low-confidence.
- Inferred regime: Mildly risk-on in IT and private banks; distribution in FMCG and energy. Without index prints, breadth, or advance/decline, do not treat this as a confirmed market-level signal.
- Action implication: Size for a headline-driven open; re-validate any directional view against actual NIFTY/BANKNIFTY prints at 09:15 IST.
Largest movers by %
No NSE pre-open movers list was retrieved. The only available prints are the F&O large-cap snapshot:
Large cap (F&O snapshot — proxy only)
| Symbol | Last (₹) | Chg % | 1W | 1M | Read |
|—|—|—|—|—|—|
| INFY.NS | 1,035.0 | +4.11% | +2.02% | −9.21% | Counter-trend bounce, vol ~1.4x avg |
| HDFCBANK.NS | 721.2 | +1.76% | −1.06% | +2.91% | Gap reclaim within uptrend |
| TCS.NS | 2,075.0 | +1.19% | −0.57% | −11.63% | Bounce inside steep monthly slide |
| RELIANCE.NS | 1,167.7 | −1.63% | −4.22% | −11.07% | Aligned downtrend |
| HINDUNILVR.NS | 1,836.0 | −2.29% | −5.04% | −7.04% | Distribution in a defensive |
Mid cap: No data retrieved.
Small cap (high risk — proceed with caution): No data retrieved. Explicit caution: small-cap movers are high risk — thin liquidity, wide spreads, and gap-prone opens. Proceed with caution and use limited risk capital only after core investments are secure.
Related news drivers
No stock-specific headlines were captured for any of the five names — the +4.11% INFY print and the HUL/RELIANCE declines have no confirmed catalyst in this feed; treat moves as technically driven until verified. Feed contents:
- Economic Times – "Ahead of Market: 10 things that will decide stock market action on Monday" — generic preview; confirms a normal Monday session is anticipated.
- Saturday bank-holiday note (Oct 3): banks operational — no settlement disruption flagged.
- Remaining headlines are US/global (Third Point chip exits, 60/40 portfolio debate, NVIDIA record highs) or tag-page noise — not India-specific drivers; do not map them onto these names.
NSE options structure ideas (educational only; not investment advice)
Chain capture failed (NSE read timeout) for all five names — no live strikes, expiries, IV, OI, or bid/ask. Tenor references assume the standard NSE single-stock monthly (late-Oct 2026); confirm expiry day, strike grid, and current lot size on the official NSE chain pages before any order. Limit orders only.
| Symbol | Bias | Primary side | Call-side structure | Put-side structure |
|—|—|—|—|—|
| INFY | Bullish (counter-trend) | CALL | Buy ~1,040 CE / sell ~1,080 CE debit spread (caps at supply 1,080–1,100); covered call vs 1,060–1,080 CE if already long | Low-conviction gap-fade: 1,020/960 put debit spread; holders: protective ~1,000 PE into mid-Oct results |
| HINDUNILVR | Bearish | PUT | Existing holders only: covered call ~1,900/1,920 CE above broken support (~1,879) | Buy ~1,840 PE / sell ~1,780 PE debit spread; alternative: protective 1,800/1,820 PE as earnings insurance |
| HDFCBANK | Mildly bullish | CALL | Buy ~720 CE / sell ~750 CE debit spread; covered call ~750 CE for holders — only if the gap holds 30–60 min after open | Lower conviction: cash-secured ~700 PE (willing-to-own) or cheap protective 700 PE against gap fade |
| RELIANCE | Bearish | PUT | Not a call-buying tape; holders: covered call ~1,220–1,250 CE | Buy ~1,170 PE / sell ~1,100 PE debit spread; accumulators: Nov cash-secured ~1,050–1,100 PE |
| TCS | Bearish (despite +1.19% print) | PUT | Lower conviction: tactical 2,100/2,150 CE spread only if ₹2,075 holds with momentum; holders: covered call 2,150/2,200 CE into elevated IV | Buy ~2,050 PE / sell ~2,000 PE debit spread through the earnings window; holders: protective 2,000/2,025 PE. Skip CSPs pre-earnings |
*Educational market-structure commentary only — not financial advice or a personalized recommendation. Defined-risk spreads still risk 100% of the debit paid.*
Risks & watch-outs
- Data integrity: No index trends, no movers list, no option chains, no bid/ask in this capture. Nothing here is executable as-is — verify every level on NSE official pages.
- Gap risk: All prints are pre-open/last-close indications. Monday 09:15 IST can gap differently; INFY's +4.11% and HDFCBANK's +1.76% are classic gap-fade candidates — re-check trend and volume after the open.
- Earnings/event risk: INFY and TCS Q2 results typically land mid-October; HUL mid/late October; RELIANCE inside its October window; RBI policy also falls in the October calendar. Expect IV ramps into prints and IV crush after — debit spreads handle this better than naked long premium.
- Trend conflict: INFY (+4.11% vs −9.21% month) and TCS (+1.19% vs −11.63% month) are fighting their own tapes; RELIANCE/HUL shorts face mean-reversion squeeze risk after −11%/−7% months.
- Liquidity/sizing: Lot sizes under SEBI's minimum contract-value framework mean large notional per lot at these prices; slippage on spread legs matters. Expect wider spreads in the first 15–30 minutes on gap opens.
- Small-cap caution (mandatory): Small-cap movers are high risk — illiquid books, wide spreads, and abrupt gaps. Proceed with caution and use limited risk capital only after core investments are secure.
- No confirmed catalysts: Absent stock-specific news, assume moves are positioning/short-covering until a headline confirms otherwise.
Visual strategy maps
Payoff curves and entry/exit zones below are educational aids — not trade instructions. Confirm with your own chart, liquidity, and risk limits.
INFY.NS: Covered Call
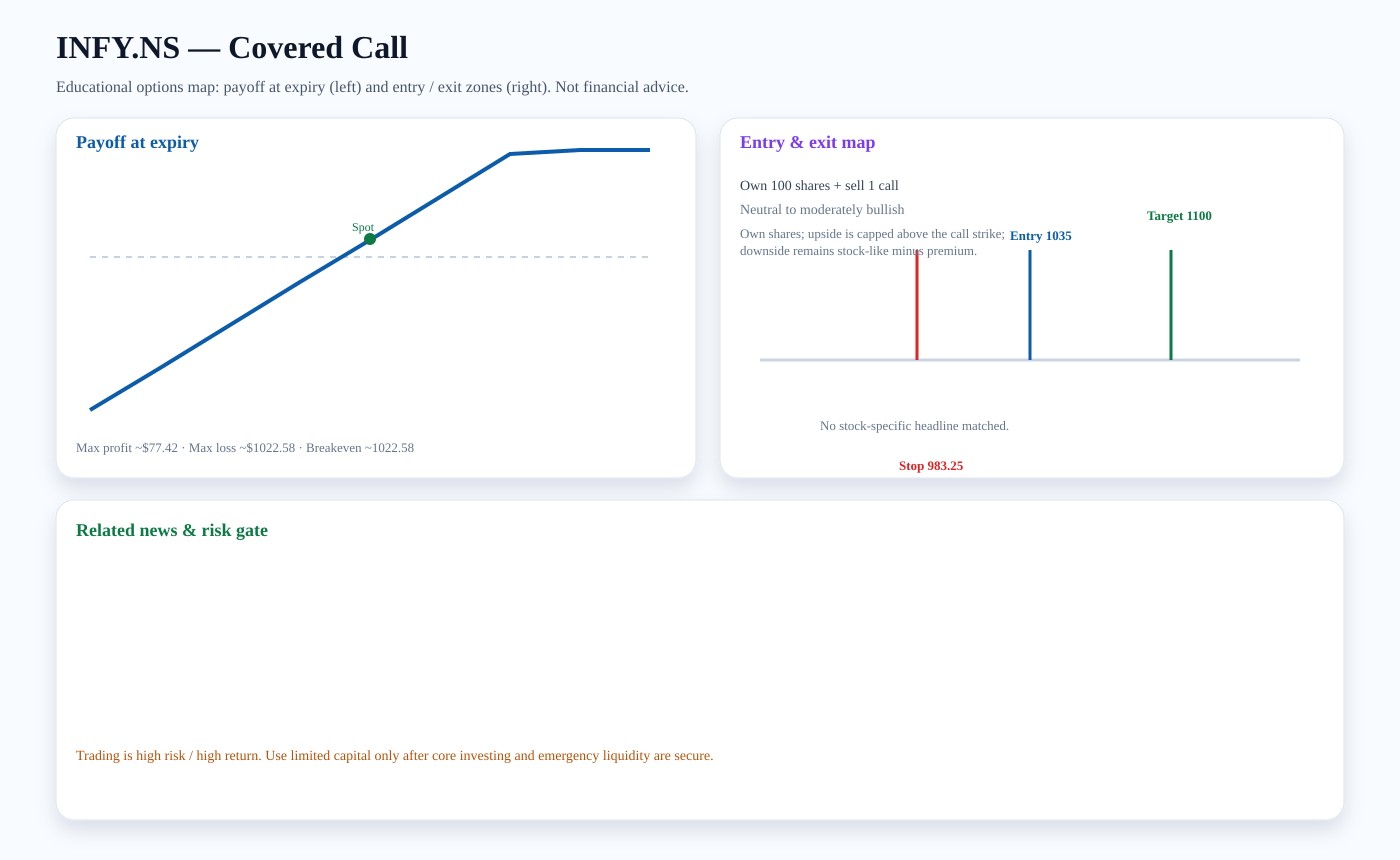
Structure: Own 100 shares + sell 1 call
Outlook: Neutral to moderately bullish
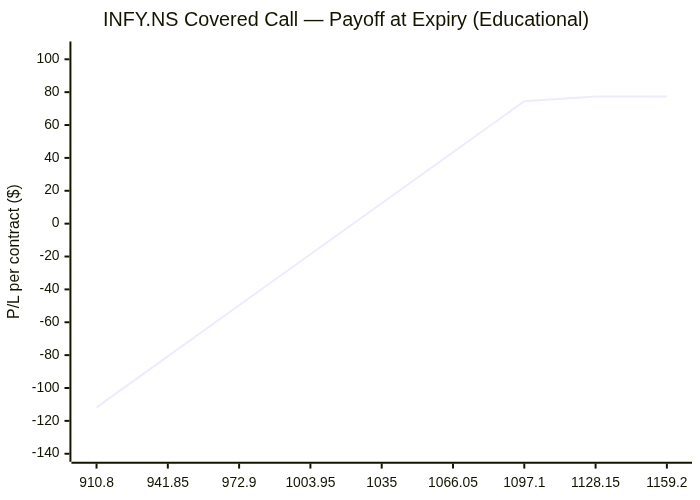
Entry zone: ~1035 · Target: ~1100 · Stop: ~983.25 · Breakeven: ~1022.58
Risk note: Own shares; upside is capped above the call strike; downside remains stock-like minus premium.
Payoff chart (Mermaid):
Entry / exit map (Mermaid):

HINDUNILVR.NS: Bear Put Spread
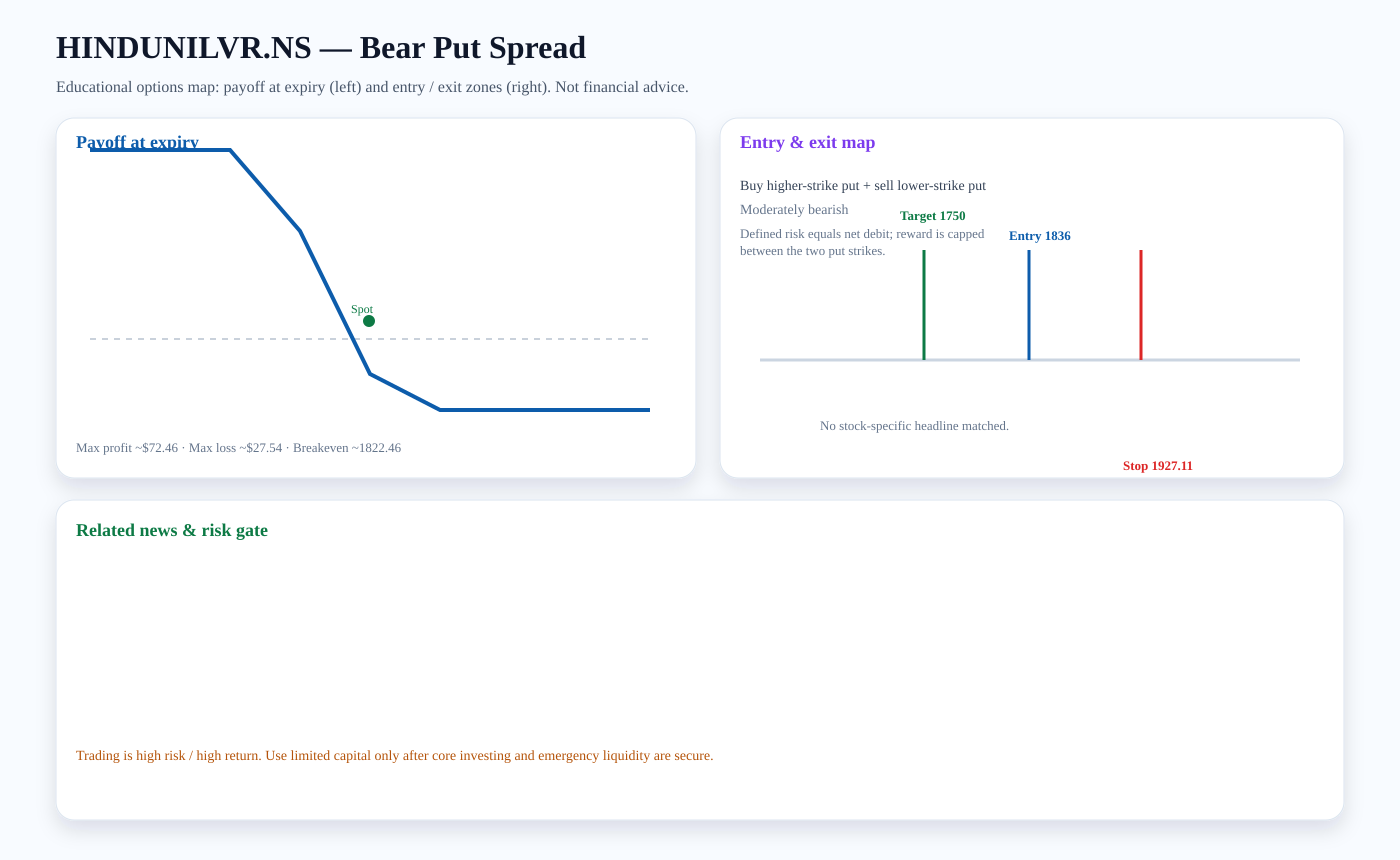
Structure: Buy higher-strike put + sell lower-strike put
Outlook: Moderately bearish
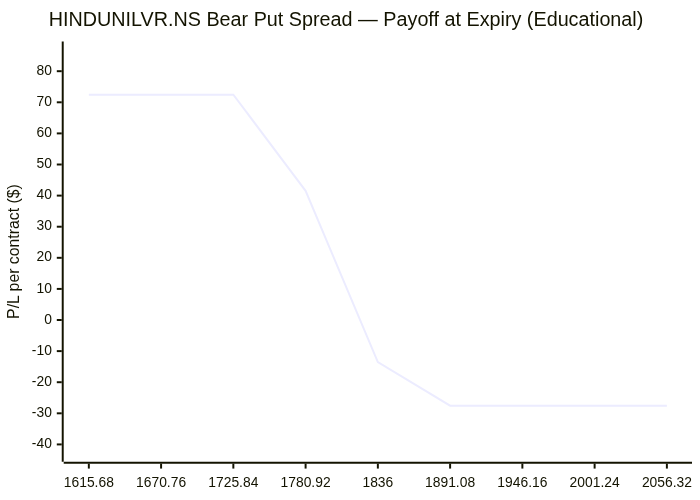
Entry zone: ~1836 · Target: ~1750 · Stop: ~1927.11 · Breakeven: ~1822.46
Risk note: Defined risk equals net debit; reward is capped between the two put strikes.
Payoff chart (Mermaid):
Entry / exit map (Mermaid):

HDFCBANK.NS: Covered Call
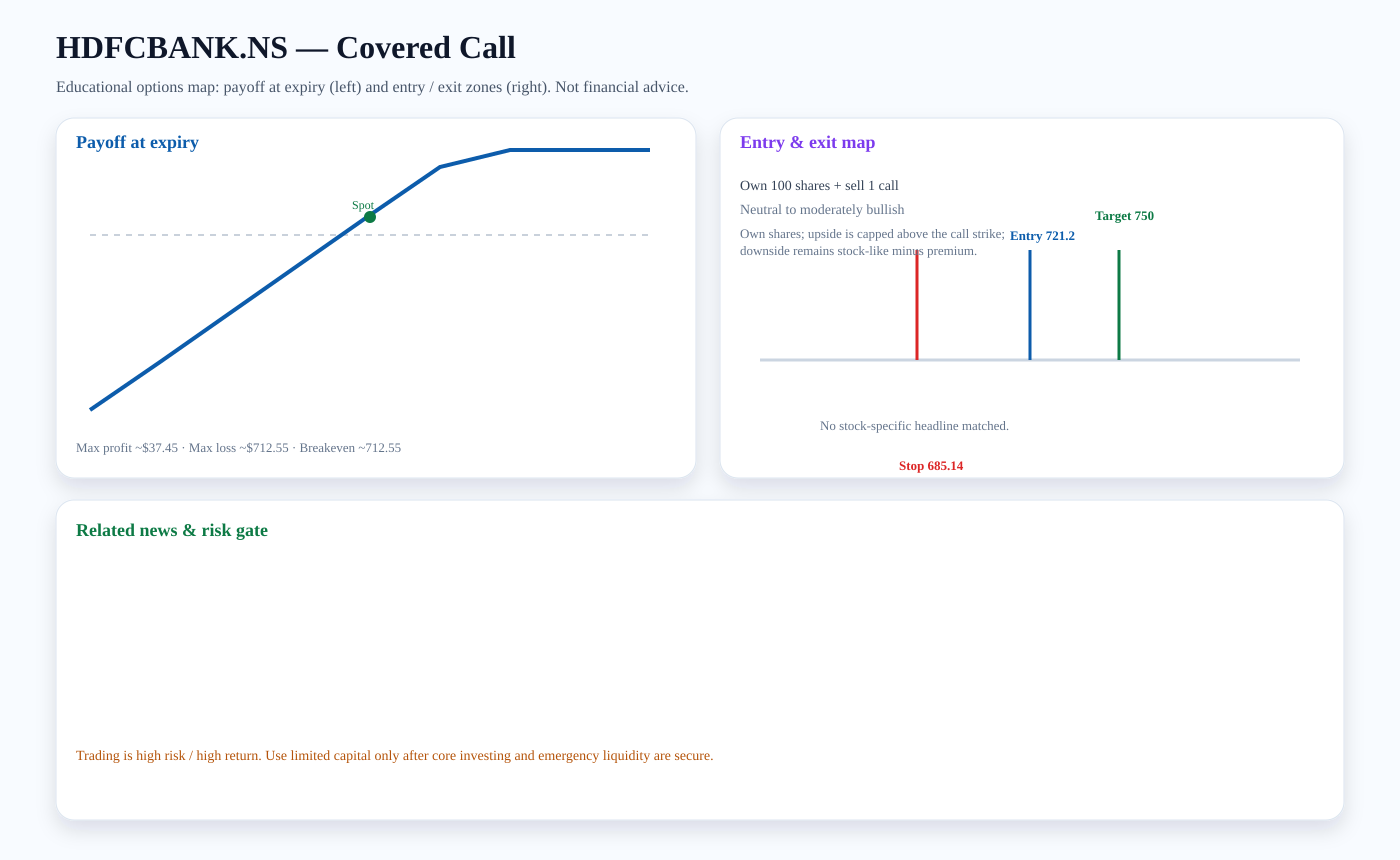
Structure: Own 100 shares + sell 1 call
Outlook: Neutral to moderately bullish
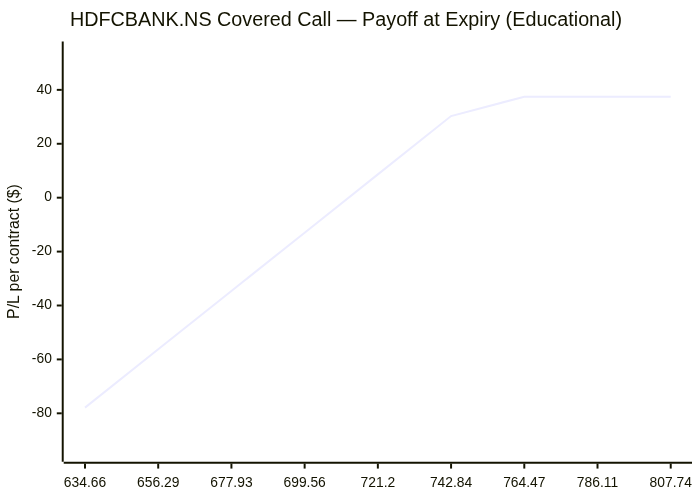
Entry zone: ~721.2 · Target: ~750 · Stop: ~685.14 · Breakeven: ~712.55
Risk note: Own shares; upside is capped above the call strike; downside remains stock-like minus premium.
Payoff chart (Mermaid):
Entry / exit map (Mermaid):

RELIANCE.NS: Bear Put Spread
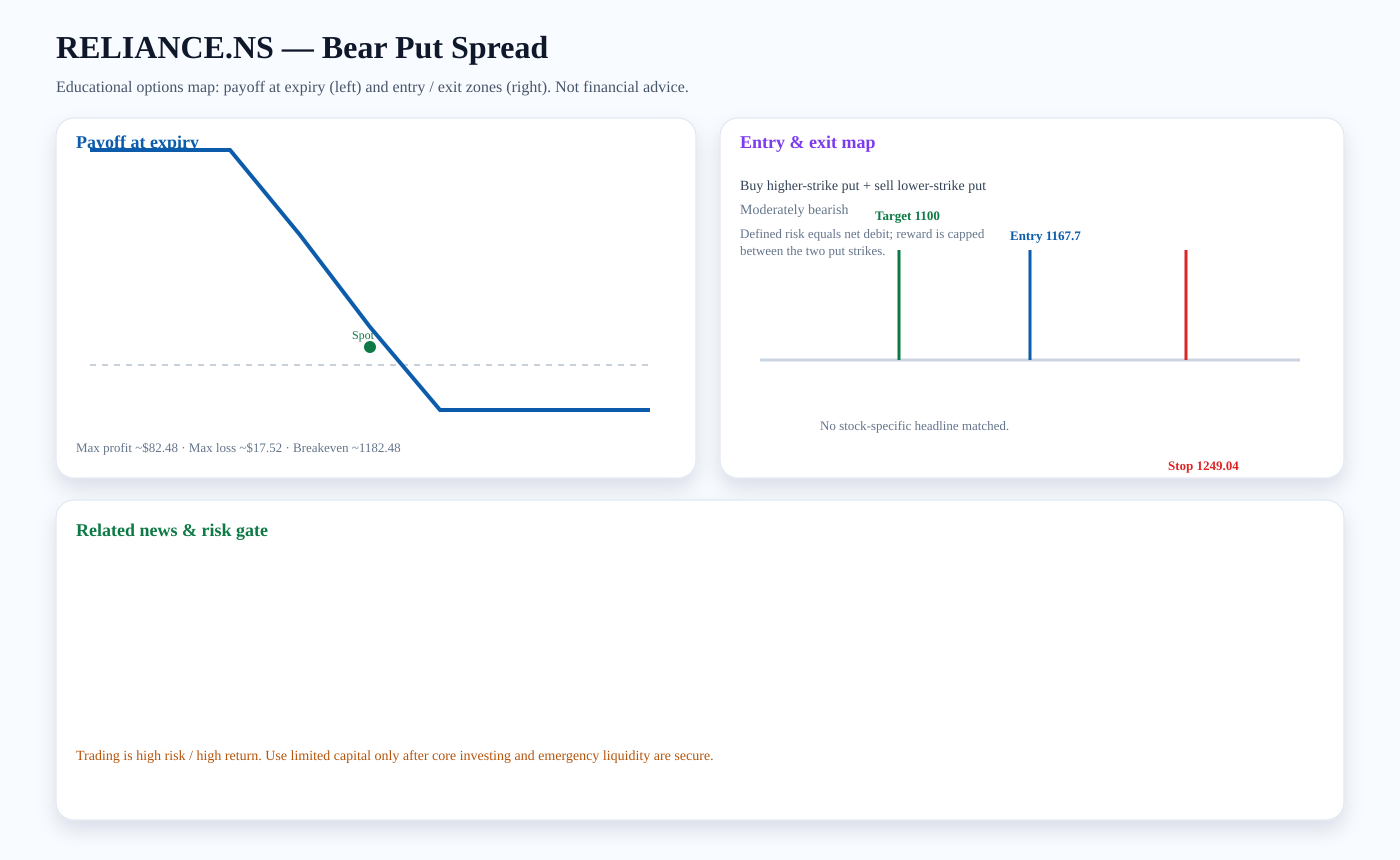
Structure: Buy higher-strike put + sell lower-strike put
Outlook: Moderately bearish
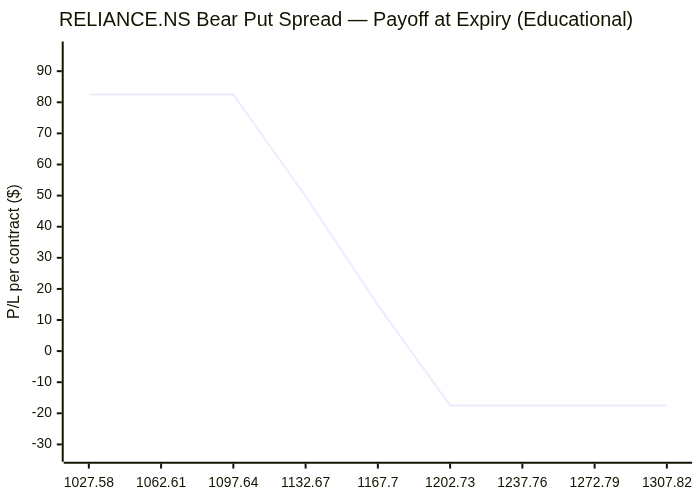
Entry zone: ~1167.7 · Target: ~1100 · Stop: ~1249.04 · Breakeven: ~1182.48
Risk note: Defined risk equals net debit; reward is capped between the two put strikes.
Payoff chart (Mermaid):
Entry / exit map (Mermaid):

Trading versus investing
Investing focuses on durable ownership, diversification, and compounding. Trading seeks faster tactical returns and carries higher risk. We treat options trading as limited-capital, educational analysis only after core investment capital and emergency liquidity are protected.
PDF report — Premium
Premium members get the full PDF attached to email briefs and can download it here. Upgrade for just $2 a month.
Subscribe for $2/month