
US Market Intelligence Brief
Report as-of (US/Eastern): 2026-06-25 09:36:18 EDT
Executive summary
Critical Data Outage: All market data feeds are experiencing complete failures as of 2026-06-25 09:36:18 EDT, preventing accurate market analysis. The trending list shows strong institutional focus on core S&P 500 ETFs (SPY, VOO, IVV), semiconductor exposure (SOXX, SMH), energy (USO, XOP), precious metals (GLD, IAU), and Taiwan markets (EWT). This suggests broad-based sector rotation interest, but without live pricing data, directional bias and momentum assessment is impossible. Recommendation: Wait for data restoration before executing any trades.
Market regime check (S&P 500 + sector/thematic ETFs)
S&P 500 Core (SPY/VOO/IVV): All three major S&P 500 ETFs dominating search trends indicates significant institutional rebalancing or hedging activity. However, complete price data unavailability prevents regime assessment.
Semiconductor Sector (SOXX/SMH): Dual semiconductor ETF presence suggests either rotation into tech or defensive positioning around chip cycle concerns. Historical context needed but unavailable.
Energy Complex (USO/XOP): Oil ETF trending alongside exploration/production suggests energy sector focus, potentially driven by geopolitical or supply/demand dynamics.
Safe Haven Assets (GLD/IAU): Gold ETF interest typically signals inflation concerns or risk-off sentiment, but current context unclear without price action.
International Exposure (EWT): Taiwan ETF presence may reflect semiconductor supply chain positioning or Asia-Pacific rebalancing.
Why these names are trending (search momentum + weekly/monthly price action)
Data Limitation: Cannot assess price momentum due to complete quote data failures. Search trends suggest:
- Institutional rebalancing: Three S&P 500 ETFs trending simultaneously indicates large-scale portfolio adjustments
- Sector rotation signals: Semiconductor, energy, and precious metals clustering suggests thematic positioning
- Risk management activity: Mix of growth (semiconductors), value (energy), and safe haven (gold) assets indicates hedging strategies
Weekly/Monthly Context: Unavailable due to trend analysis system failures across all names.
Key news drivers
Limited News Flow: Only fragment available mentions Sunrun (RUN) +28.57% gain, suggesting potential renewable energy sector momentum. However, this doesn't directly connect to the trending ETF list.
Inference from Trending Names: The ETF clustering pattern suggests:
- Broad market repositioning (S&P 500 ETFs)
- Technology sector focus (semiconductor ETFs)
- Energy sector attention (oil ETFs)
- Defensive positioning (gold ETFs)
Durable momentum ideas (mid/high-cap focus)
Cannot Recommend Specific Positions due to data outage, but structural themes from trending list:
Core Holdings: SPY, VOO, IVV represent the highest-quality, most liquid market exposure with institutional-grade liquidity.
Thematic Exposure:
- SOXX/SMH: Semiconductor sector exposure for AI/chip cycle plays
- USO/XOP: Energy sector positioning for commodity exposure
- GLD/IAU: Precious metals for inflation/currency hedging
Sustainability Factors: All trending names represent established, liquid ETFs with strong institutional backing, suggesting durable interest rather than speculative momentum.
Options / structure ideas
Educational note: This analysis is for educational purposes only and not financial advice.
Primary Limitation: Complete options chain data unavailability prevents specific structure recommendations.
General Framework When Data Returns:
Call-Side Structures (for bullish positioning):
- SPY/VOO/IVV: Call debit spreads (excellent liquidity)
- SOXX/SMH: Call debit spreads (higher volatility, wider spreads expected)
Put-Side Structures (for hedging/bearish positioning):
- SPY/VOO/IVV: Put debit spreads or protective puts
- GLD/IAU: Put spreads if positioning against dollar strength
Primary Side: Cannot determine without current price levels and implied volatility data.
Risks & watch-outs
Immediate Risks:
- Data integrity failure: Complete market data outage creates blind trading environment
- Execution risk: Cannot assess fair value or liquidity without live quotes
- Timing risk: Market may have moved significantly during data outage period
Structural Risks:
- Sector concentration: Heavy semiconductor exposure (SOXX/SMH) creates tech beta risk
- Commodity volatility: Energy (USO/XOP) and gold (GLD/IAU) subject to macro shocks
- International exposure: EWT adds currency and geopolitical risk
Recommendation: Wait for complete data restoration before executing any positions. The trending name quality is high, but trading without current market data is extremely hazardous.
Visual strategy maps
Payoff curves and entry/exit zones below are educational aids — not trade instructions. Confirm with your own chart, liquidity, and risk limits.
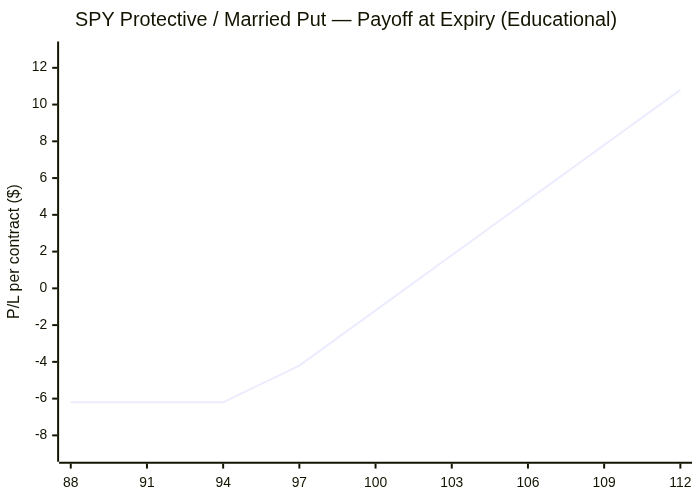
SPY: Protective / Married Put
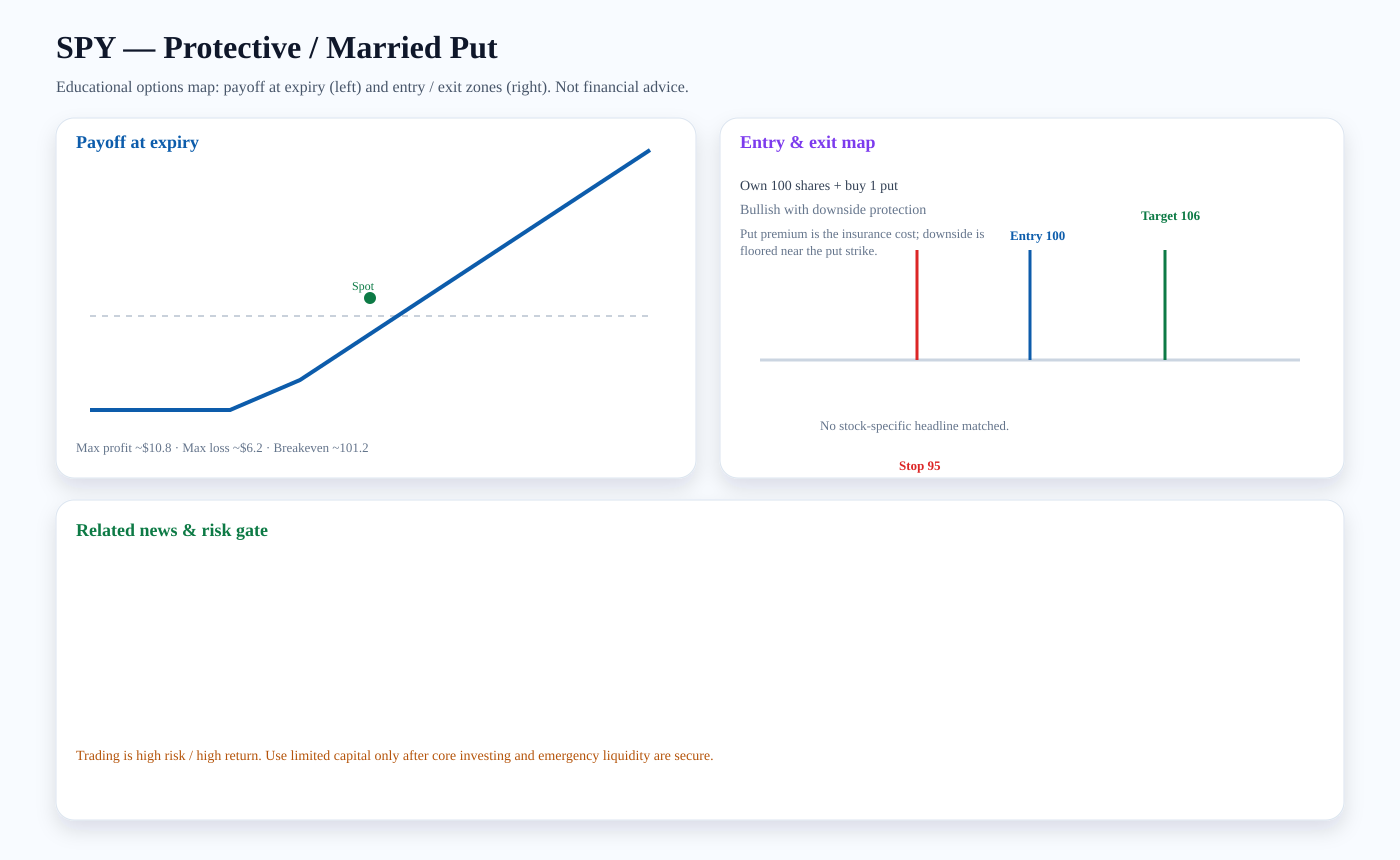
Structure: Own 100 shares + buy 1 put
Outlook: Bullish with downside protection
Entry zone: ~100 · Target: ~106 · Stop: ~95 · Breakeven: ~101.2
Risk note: Put premium is the insurance cost; downside is floored near the put strike.
Payoff chart (Mermaid):
Entry / exit map (Mermaid):

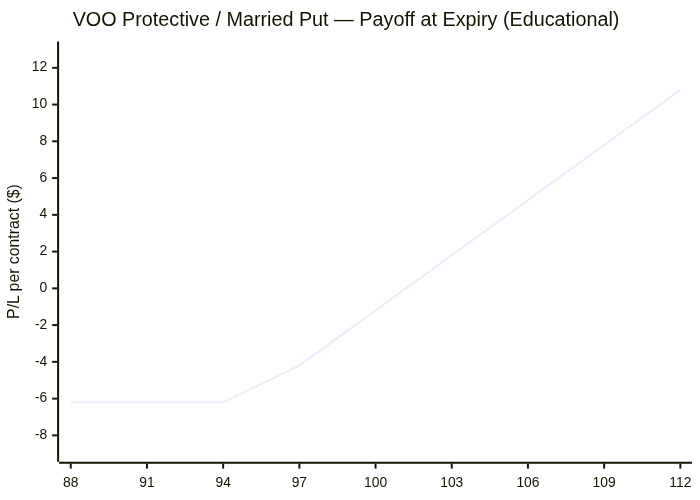
VOO: Protective / Married Put
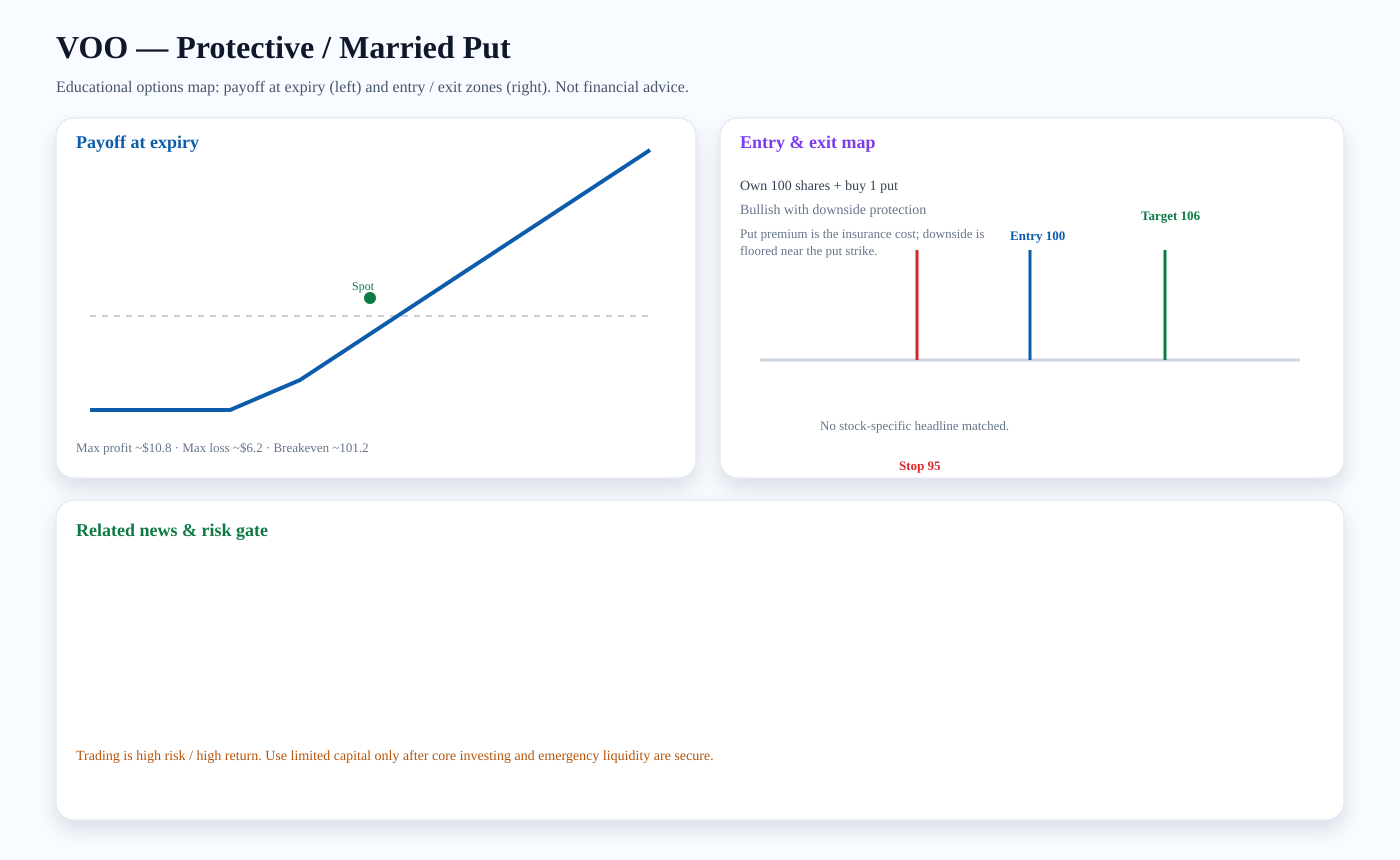
Structure: Own 100 shares + buy 1 put
Outlook: Bullish with downside protection
Entry zone: ~100 · Target: ~106 · Stop: ~95 · Breakeven: ~101.2
Risk note: Put premium is the insurance cost; downside is floored near the put strike.
Payoff chart (Mermaid):
Entry / exit map (Mermaid):

IVV: Protective / Married Put
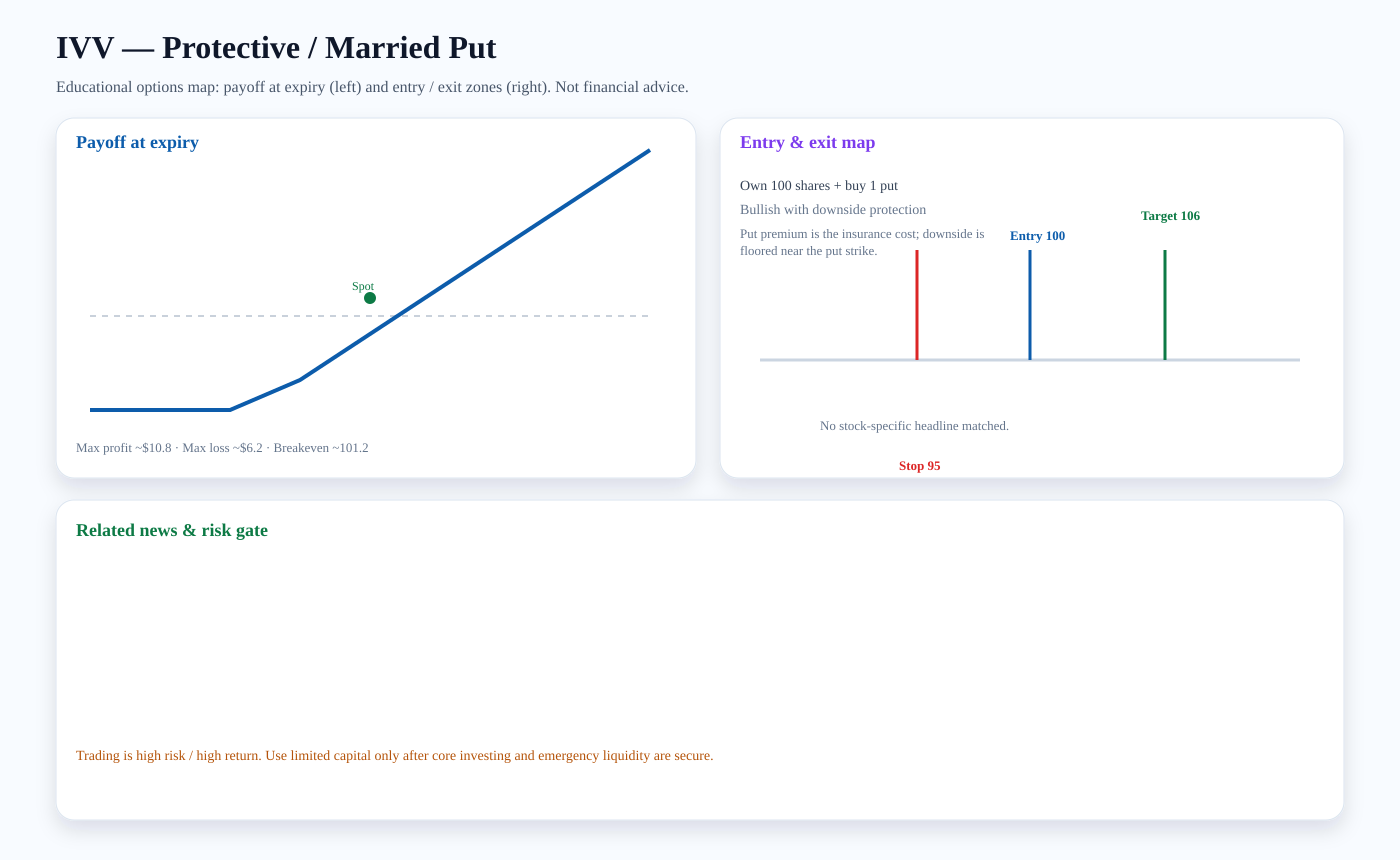
Structure: Own 100 shares + buy 1 put
Outlook: Bullish with downside protection
Entry zone: ~100 · Target: ~106 · Stop: ~95 · Breakeven: ~101.2
Risk note: Put premium is the insurance cost; downside is floored near the put strike.
Payoff chart (Mermaid):
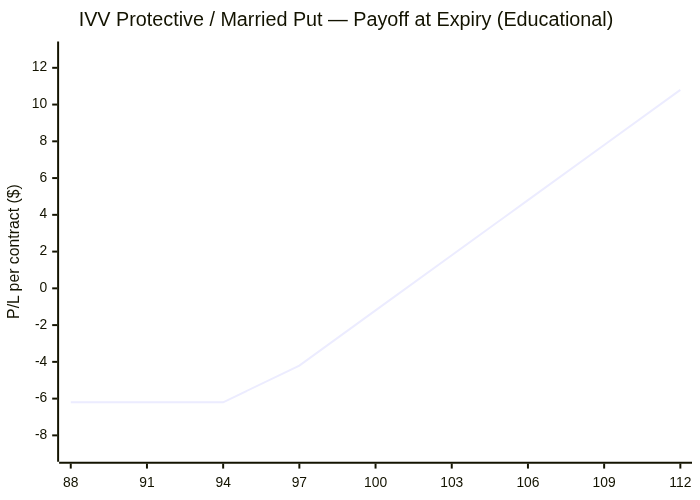
Entry / exit map (Mermaid):

EWT: Bear Put Spread
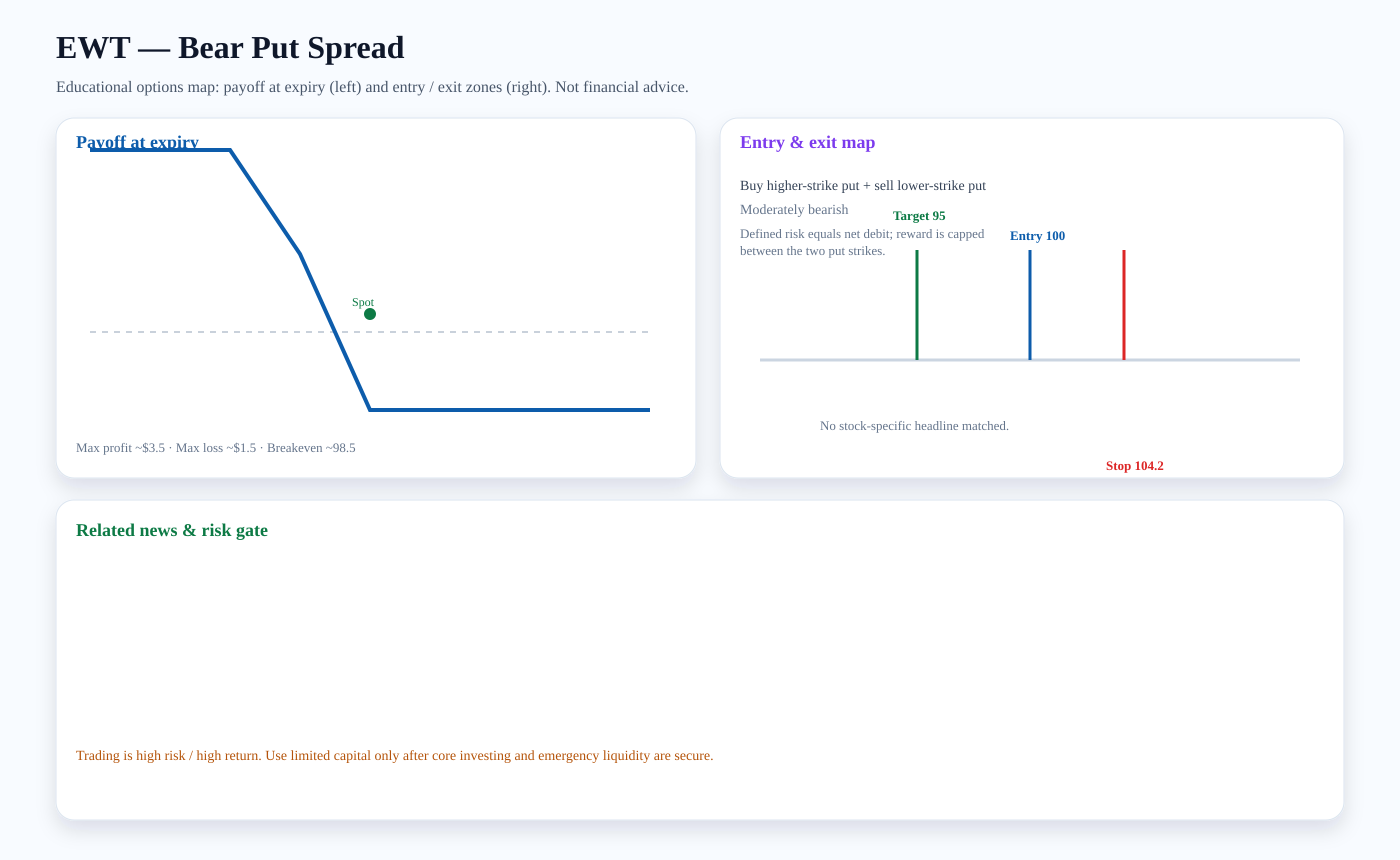
Structure: Buy higher-strike put + sell lower-strike put
Outlook: Moderately bearish
Entry zone: ~100 · Target: ~95 · Stop: ~104.2 · Breakeven: ~98.5
Risk note: Defined risk equals net debit; reward is capped between the two put strikes.
Payoff chart (Mermaid):
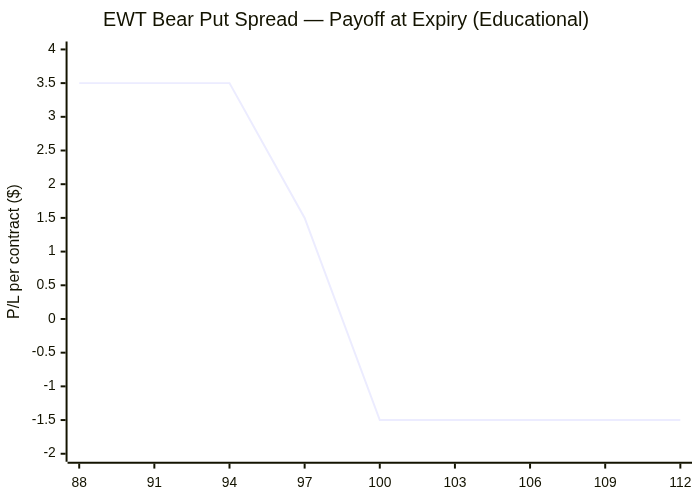
Entry / exit map (Mermaid):

Trading versus investing
Investing focuses on durable ownership, diversification, and compounding. Trading seeks faster tactical returns and carries higher risk. We treat options trading as limited-capital, educational analysis only after core investment capital and emergency liquidity are protected.
PDF report — Premium
Premium members get the full PDF attached to email briefs and can download it here. Upgrade for just $2 a month.
Subscribe for $2/month