
US Market Intelligence Brief
Report as-of (US/Eastern): 2026-06-25 15:32:16 EDT
Executive summary
Report as-of (US/Eastern): 2026-06-25 15:32:16 EDT
The US market is experiencing a sharp semiconductor sector rotation driven by AI infrastructure demand, with memory and chip equipment names surging while mega-cap tech faces pressure. SNDK (+19.65%) and AMAT (+10.93%) are leading gains on AI chip production tailwinds, while AAPL (-5.67%) and MSFT (-3.41%) decline on cost concerns and broader tech weakness. The divergence suggests investors are rotating from software/consumer tech into hardware infrastructure plays, with Micron's strong earnings catalyzing the memory sector rally.
Market regime check (S&P 500 + sector/thematic ETFs)
While specific ETF data isn't provided, the stock movements suggest a sector rotation regime rather than broad market directional move. The semiconductor equipment and memory sectors are experiencing significant outperformance (+10-20% moves), while established mega-cap tech shows weakness (-3-6% declines). This pattern typically indicates:
- Risk-on sentiment in AI infrastructure themes
- Rotation away from mature tech platforms toward hardware enablers
- Earnings-driven momentum in semiconductor supply chain
- Potential overextension in chip names given rapid 1-month gains (+40-45%)
Why these names are trending (search momentum + weekly/monthly price action)
Momentum leaders:
- SNDK: Weekly +17.36%, Monthly +44.63% – benefiting from AI memory demand surge
- AMAT: Weekly +10.19%, Monthly +43.62% – new AI chip systems driving equipment demand
Momentum laggards:
- AAPL: Weekly -6.55%, Monthly -10.30% – cost pressures from AI chip shortage
- MSFT: Weekly -6.84%, Monthly -15.15% – broader tech weakness despite AI positioning
The trending pattern reflects a "picks and shovels" rotation where investors favor AI infrastructure providers over end-user platforms facing margin pressure.
Key news drivers
Primary catalyst: Applied Materials launched six new chipmaking systems for AI-driven DRAM production, with shares jumping 7.1% on the announcement. The company's innovations in 3D chip architectures are positioning it as a key AI infrastructure enabler.
Secondary drivers:
- Micron's blockbuster earnings lifting entire memory sector, with SNDK specifically benefiting from "justified elevated valuations"
- Apple's cost pass-through to consumers for AI-enhanced Mac/iPad products raising demand concerns
- Qualcomm's $4B acquisition of chip startup Modular highlighting continued AI infrastructure consolidation
- Broader AI chip shortage creating supply/demand imbalances across the ecosystem
Durable momentum ideas (mid/high-cap focus)
AMAT (Applied Materials) – Most compelling risk/reward
- Catalyst durability: New AI chip systems provide multi-quarter revenue visibility
- Market position: Dominant in semiconductor equipment with high switching costs
- Earnings catalyst: August 13th earnings date provides near-term focus
- Valuation support: Trading on fundamentals vs. speculation
SNDK (SanDisk) – Momentum play with caution
- AI memory demand: Structural tailwind from data center buildouts
- Sector rotation: Benefiting from Micron's validation of memory pricing power
- Risk: 44% monthly gain suggests potential overextension
Avoid for momentum: AAPL/MSFT facing structural headwinds from AI cost pressures and margin compression.
Options / structure ideas
*Educational content only – not financial advice. Options trading involves substantial risk.*
AMAT – Primary: CALL debit spreads
- Call structure: 655/670 debit spread (July 2nd expiry) capturing momentum with defined risk
- Put structure: Cash-secured puts at 630-640 for pullback entries
- Rationale: Strong fundamental catalyst with reasonable IV levels (67-84%)
SNDK – Primary: CALL debit spreads
- Call structure: 2300/2350 debit spread managing high premium costs
- Put structure: Cash-secured puts at 2250 for mean reversion plays
- Caution: Extremely high IV (93-102%) and extended valuations
AAPL – Primary: PUT debit spreads
- Put structure: 280/270 or 275/265 spreads targeting continued weakness
- Call structure: Covered calls at 285-290 resistance if holding shares
- Catalyst: AI cost pressures creating sustained headwinds
MSFT – Primary: PUT debit spreads
- Put structure: 355/350 or 350/345 spreads on technical breakdown
- Call structure: Small bounce plays at 355/360 for oversold relief
- Trend: Accelerating weekly/monthly declines suggest more downside
Risks & watch-outs
Immediate risks:
- Sector overextension: 40%+ monthly gains in chip names suggest potential pullback
- High implied volatility: Options premiums elevated across all names, favoring sellers
- Earnings sensitivity: AMAT earnings (Aug 13) could reverse momentum if disappointing
Structural concerns:
- AI infrastructure bubble: Rapid valuations expansion may not be sustainable
- Supply chain disruption: Geopolitical tensions could impact semiconductor trade
- Interest rate sensitivity: Tech sector remains vulnerable to monetary policy shifts
- Rotation risk: Current momentum could reverse quickly on macro changes
Position sizing: Given elevated volatility and sector concentration, consider smaller position sizes and defined-risk strategies over naked long/short exposure.
Visual strategy maps
Payoff curves and entry/exit zones below are educational aids — not trade instructions. Confirm with your own chart, liquidity, and risk limits.
SNDK: Bull Call Spread
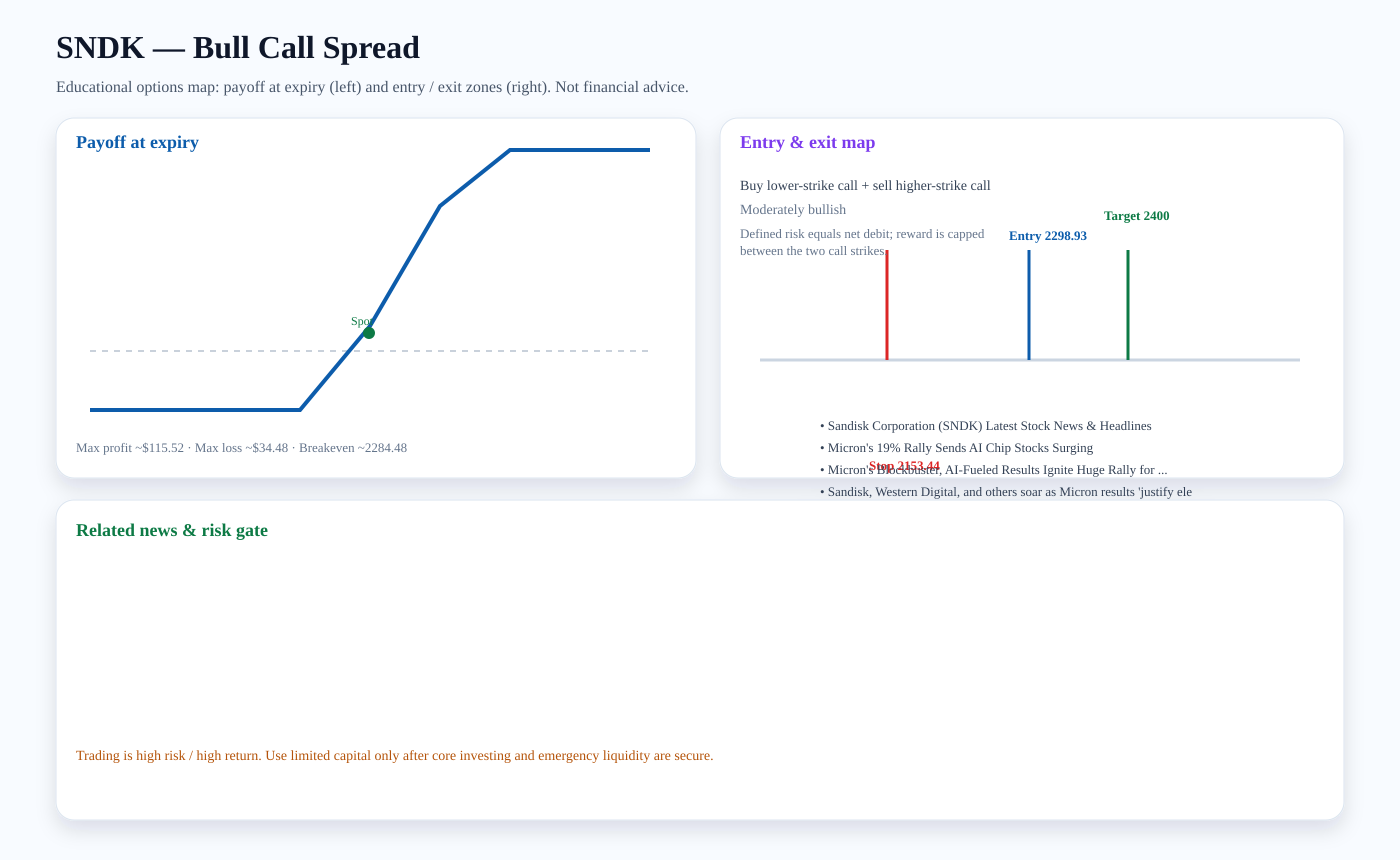
Structure: Buy lower-strike call + sell higher-strike call
Outlook: Moderately bullish
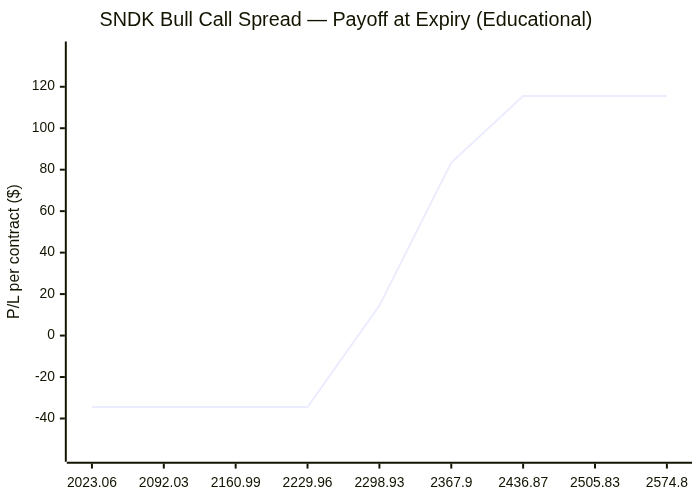
Entry zone: ~2298.93 · Target: ~2400 · Stop: ~2153.44 · Breakeven: ~2284.48
Risk note: Defined risk equals net debit; reward is capped between the two call strikes.
Related news links:
Payoff chart (Mermaid):
Entry / exit map (Mermaid):

AMAT: Bull Call Spread
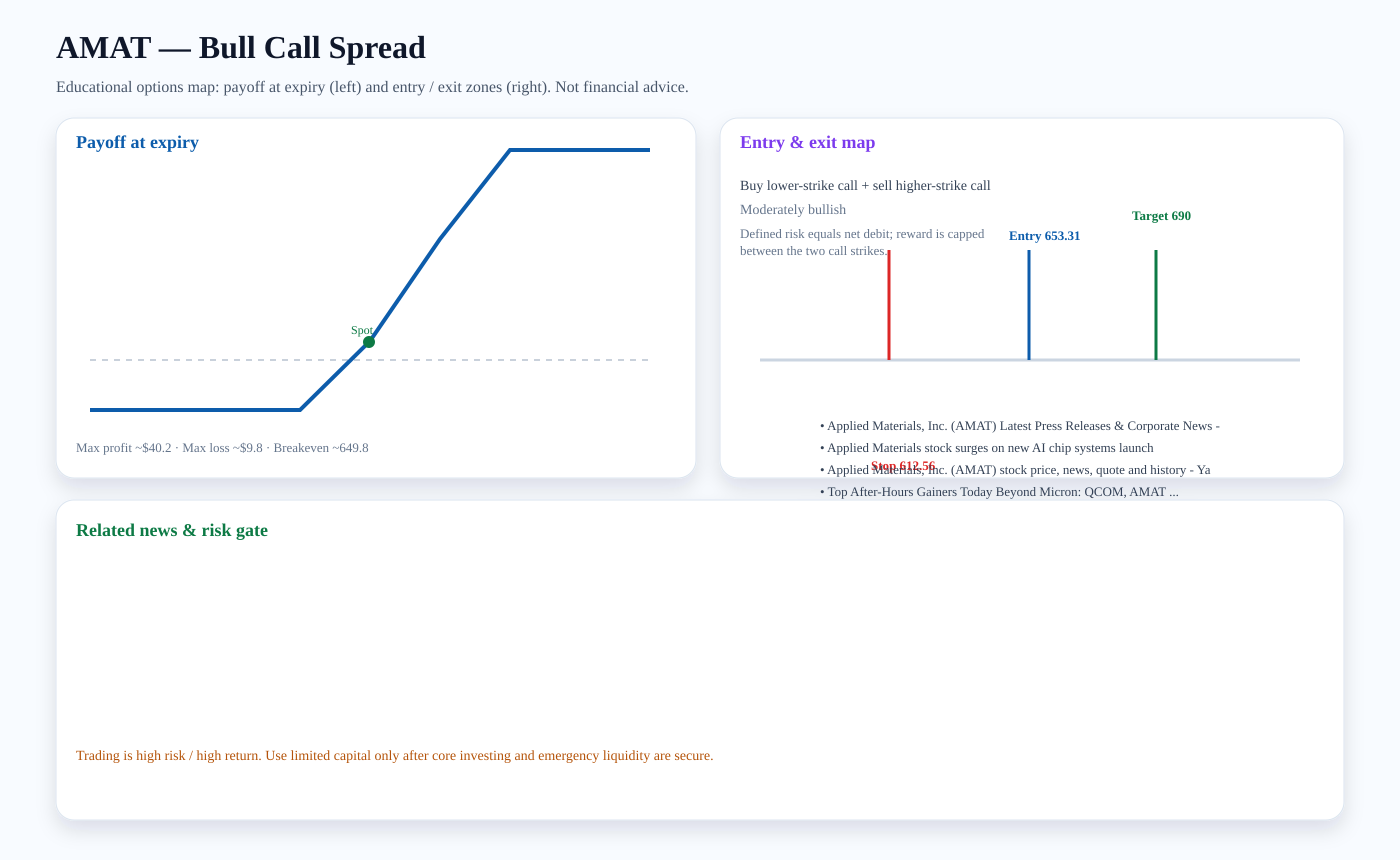
Structure: Buy lower-strike call + sell higher-strike call
Outlook: Moderately bullish
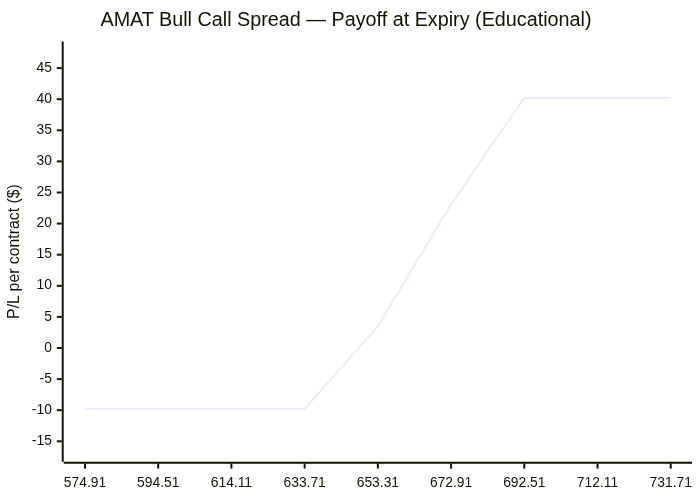
Entry zone: ~653.31 · Target: ~690 · Stop: ~612.56 · Breakeven: ~649.8
Risk note: Defined risk equals net debit; reward is capped between the two call strikes.
Related news links:
Payoff chart (Mermaid):
Entry / exit map (Mermaid):

MSFT: Bear Put Spread
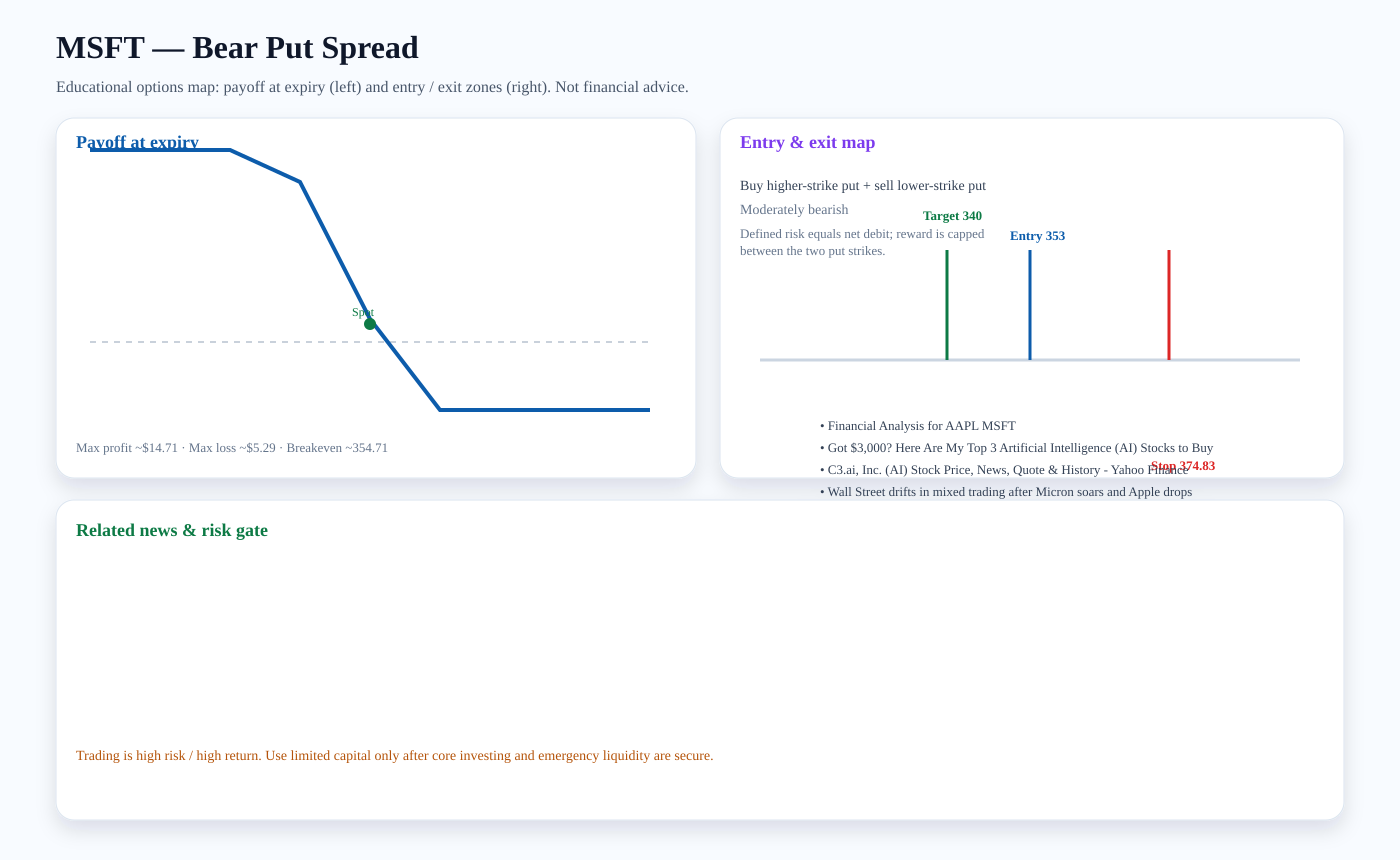
Structure: Buy higher-strike put + sell lower-strike put
Outlook: Moderately bearish
Entry zone: ~353 · Target: ~340 · Stop: ~374.83 · Breakeven: ~354.71
Risk note: Defined risk equals net debit; reward is capped between the two put strikes.
Related news links:
Payoff chart (Mermaid):
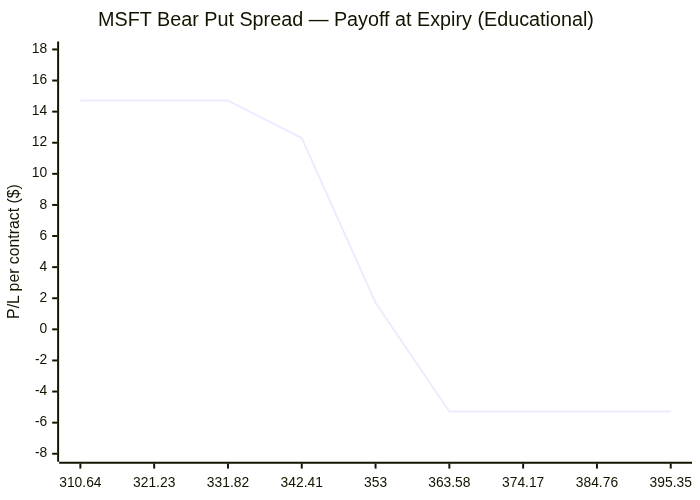
Entry / exit map (Mermaid):

AAPL: Bear Put Spread
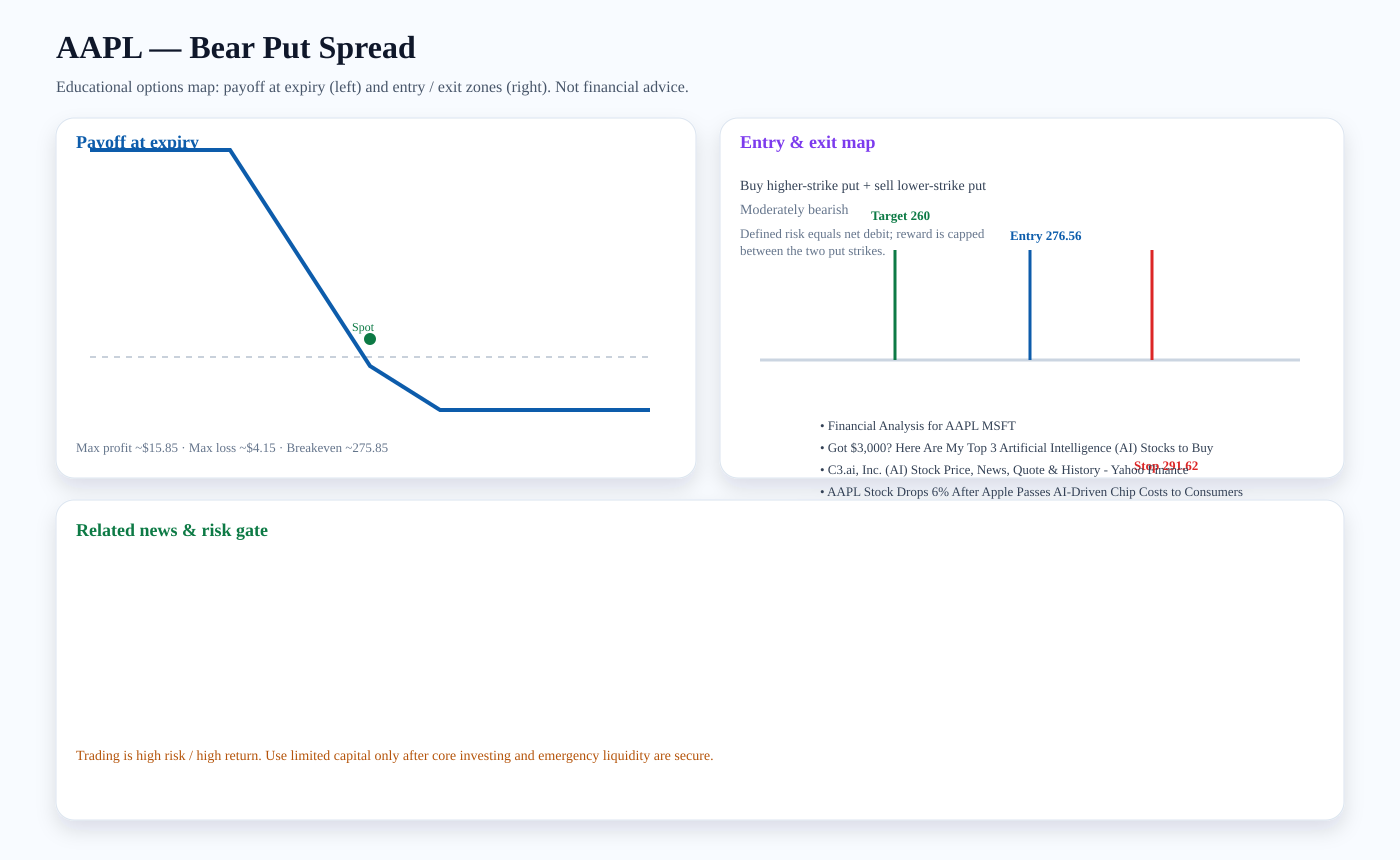
Structure: Buy higher-strike put + sell lower-strike put
Outlook: Moderately bearish
Entry zone: ~276.56 · Target: ~260 · Stop: ~291.62 · Breakeven: ~275.85
Risk note: Defined risk equals net debit; reward is capped between the two put strikes.
Related news links:
Payoff chart (Mermaid):
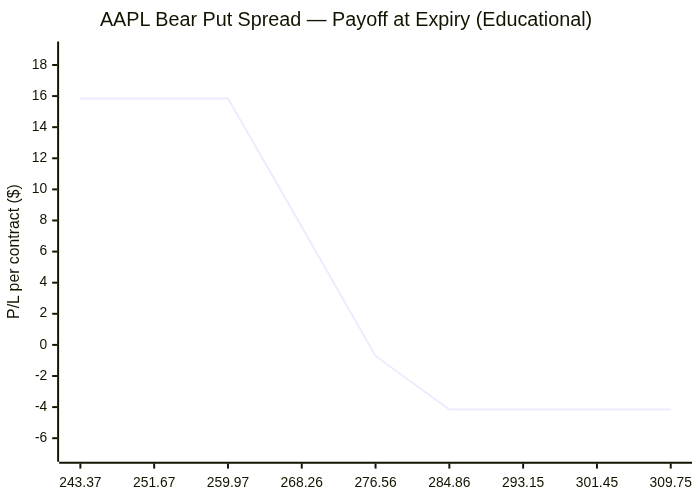
Entry / exit map (Mermaid):

Trading versus investing
Investing focuses on durable ownership, diversification, and compounding. Trading seeks faster tactical returns and carries higher risk. We treat options trading as limited-capital, educational analysis only after core investment capital and emergency liquidity are protected.
PDF report — Premium
Premium members get the full PDF attached to email briefs and can download it here. Upgrade for just $2 a month.
Subscribe for $2/month