
India (NSE) Market Intelligence Brief
Report as-of (US/Eastern): 2026-06-30 23:45:58 EDT
Data sources: NSE pre-open F&O and NSE derivatives quotes
Executive summary
Report as-of (US/Eastern): 2026-06-30 23:45:58 EDT
NSE pre-open F&O data shows mixed sentiment with IT majors INFY (+1.02%) and TCS (+0.89%) attempting recovery from severe sector weakness, while ICICIBANK (-0.39%) pulls back from strong monthly gains. The IT sector faces continued AI disruption concerns despite today's bounce, with Nifty IT hitting 3-year lows. Banking remains mixed with KOTAKBANK (+0.96%) advancing while ICICI retreats. Consumer staple HINDUNILVR (+0.89%) shows steady momentum.
Data sources: NSE pre-open F&O page and NSE official derivatives quote pages
Index & F&O pre-open regime
No NSE index data retrieved – Unable to assess NIFTY, BANKNIFTY, MIDCPNIFTY, or other derivative index trends from official NSE sources during this capture window.
Largest movers by %
Large cap
- INFY.NS: ₹1010.6 (+1.02%) – Recovery attempt from IT sector weakness
- KOTAKBANK.NS: ₹396.0 (+0.96%) – Banking strength continues
- TCS.NS: ₹2049.6 (+0.89%) – Bounce from 3-year sector lows
- HINDUNILVR.NS: ₹2137.1 (+0.89%) – Consumer staple momentum
- ICICIBANK.NS: ₹1369.9 (-0.39%) – Pullback from monthly highs
Mid cap
No NSE pre-open movers found in mid-cap segment during this data capture.
Small cap (high risk — proceed with caution)
No NSE pre-open movers found in small-cap segment.
⚠️ Small-cap caution: Small-cap stocks carry high liquidity risk and gap exposure. Investors should proceed with extreme caution and allocate only limited risk capital after securing core portfolio investments.
Related news drivers
IT Sector Under Pressure: Nifty IT hits fresh 52-week lows and 3-year lows with 30% YTD decline. TCS and other majors face AI disruption concerns, with hiring for GenAI roles up 205% signaling sector transformation challenges.
Global Tech Weakness: Magnificent Seven stocks lose $2.3 trillion as AI fears mount, creating spillover effects to Indian IT exporters.
AI Disruption Theme: Multiple headlines highlight AI as both opportunity (GenAI hiring surge) and threat (traditional IT services displacement) for Indian technology companies.
NSE options structure ideas (educational)
Primary Focus: IT Sector Recovery Plays
INFY.NS – Call debit spread (1010/1040) targeting bounce from oversold levels despite monthly -18.75% decline. Primary: Call side given +1.02% pre-open strength.
TCS.NS – Put debit spread targeting continued weakness below ₹2050 support. Primary: Put side given sector headwinds and AI disruption fears outweighing today's bounce.
Banking Sector Mixed Signals
KOTAKBANK.NS – Call debit spread (400/410) on continued monthly uptrend (+4.47%). Primary: Call side with weekly pullback creating entry opportunity.
ICICIBANK.NS – Put debit spread on near-term weakness despite strong monthly gains (+11.68%). Primary: Put side for short-term directional play.
Defensive Consumer Play
HINDUNILVR.NS – Call debit spread (2140/2180) on steady momentum and sector stability. Primary: Call side given consistent performance.
Critical limitation: NSE options chain data unavailable due to connection timeout – verify all bid/ask spreads and liquidity independently before execution.
Risks & watch-outs
Data Access Risk: Limited NSE derivatives chain visibility impacts precise options structure execution and liquidity assessment.
IT Sector Volatility: Despite today's bounce, structural AI disruption concerns and 30% YTD decline create high volatility environment for technology stocks.
Small-Cap Liquidity Risk: No small-cap movers identified, but any small-cap positions carry significant gap risk and limited liquidity during volatile sessions.
Currency Exposure: INR volatility affects IT exporters and banking sector performance, particularly relevant for international investors.
Options Execution Risk: Without live NSE chain data, bid/ask spreads and open interest cannot be verified – essential for proper options strategy implementation.
Visual strategy maps
Payoff curves and entry/exit zones below are educational aids — not trade instructions. Confirm with your own chart, liquidity, and risk limits.
INFY.NS: Bull Call Spread
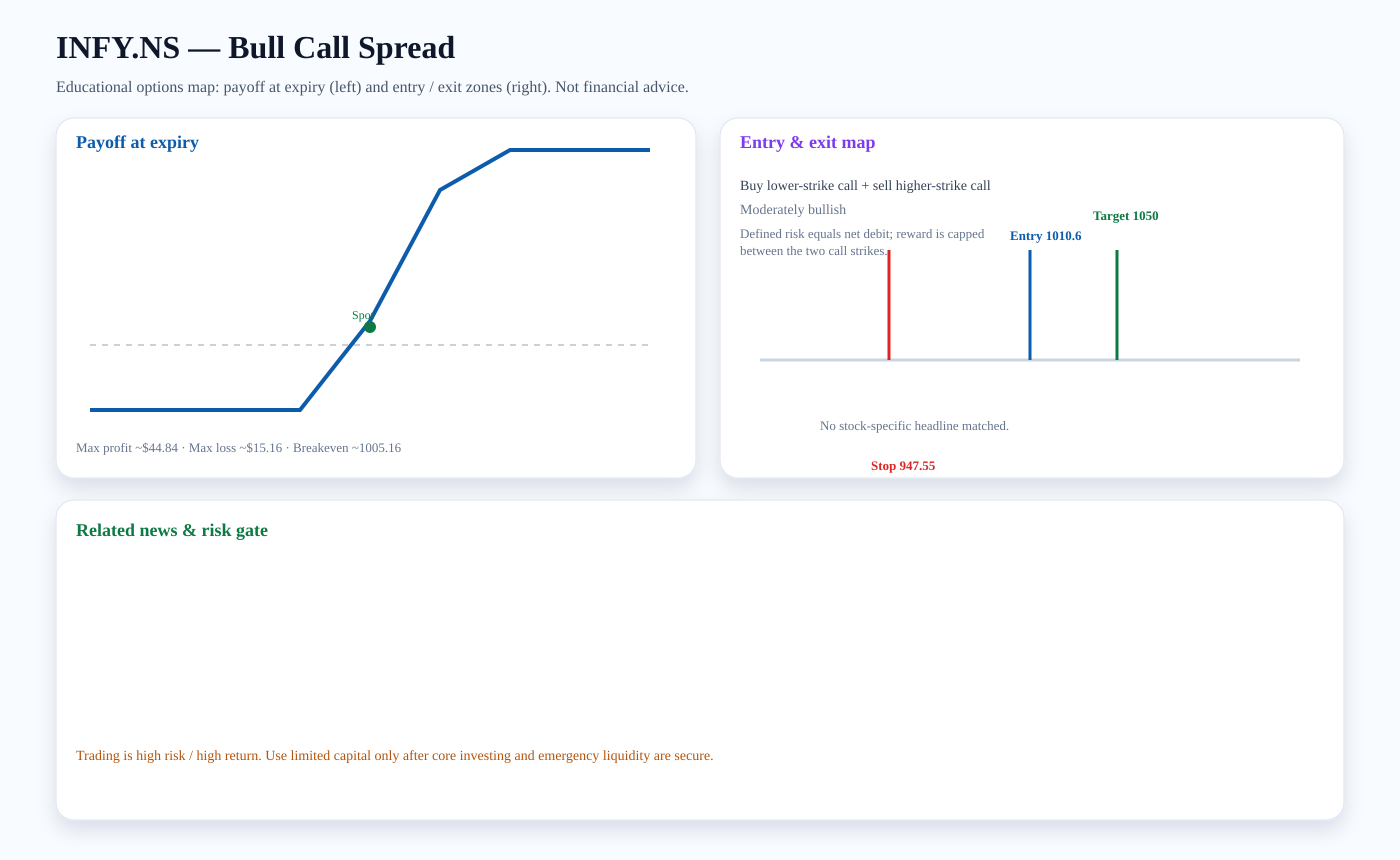
Structure: Buy lower-strike call + sell higher-strike call
Outlook: Moderately bullish
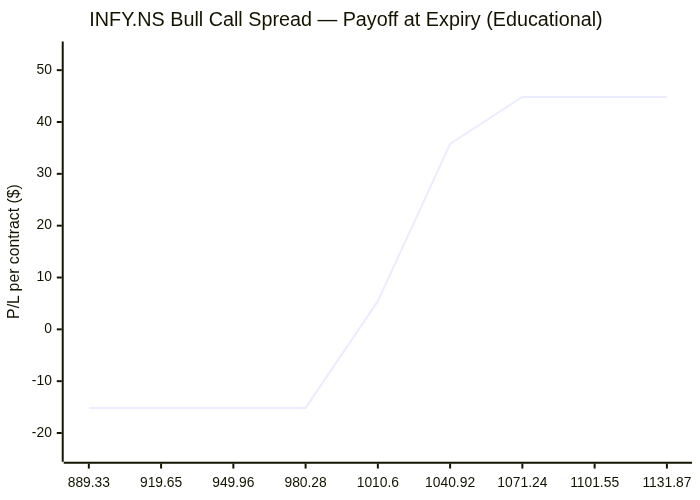
Entry zone: ~1010.6 · Target: ~1050 · Stop: ~947.55 · Breakeven: ~1005.16
Risk note: Defined risk equals net debit; reward is capped between the two call strikes.
Payoff chart (Mermaid):
Entry / exit map (Mermaid):

KOTAKBANK.NS: Bull Call Spread
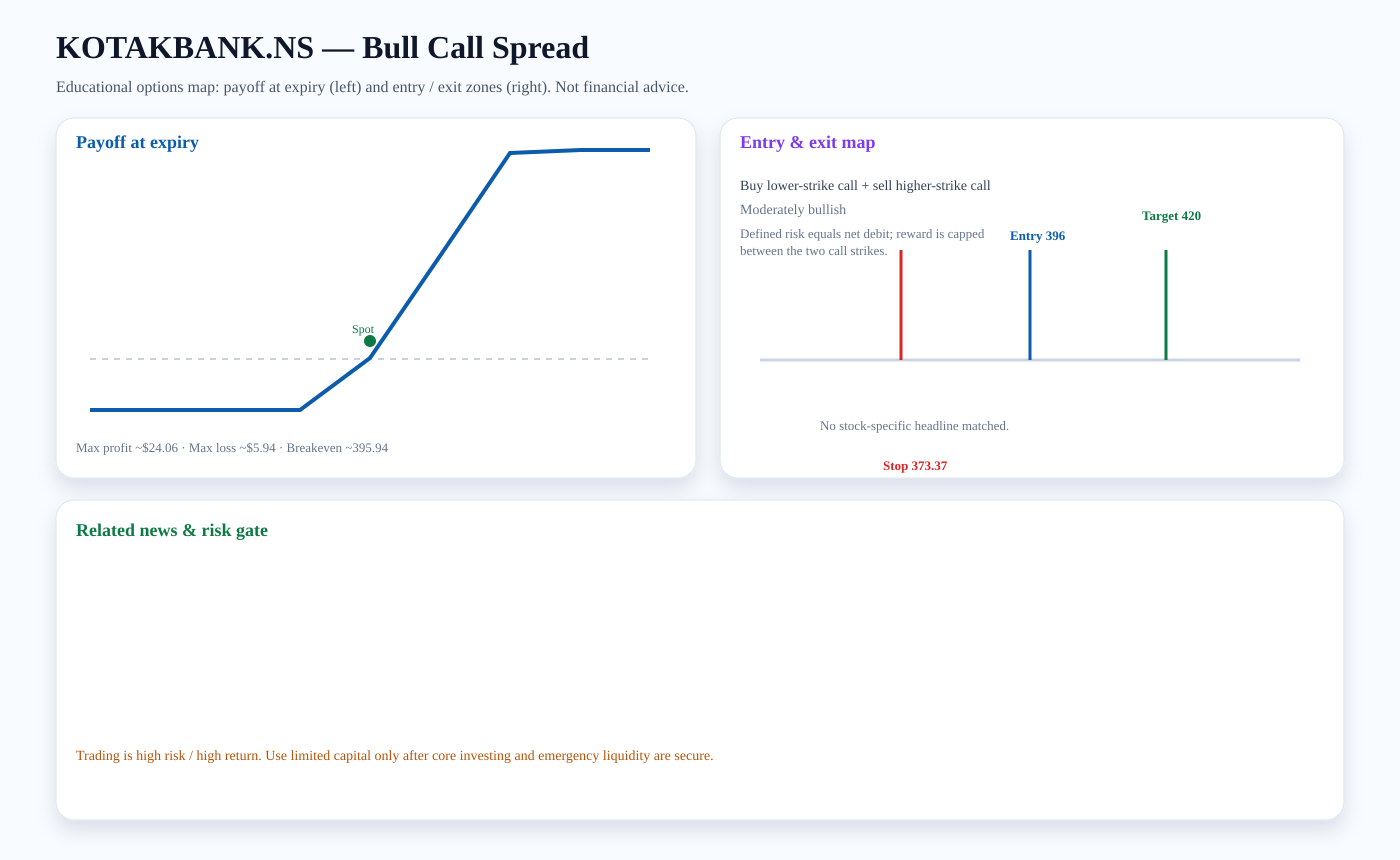
Structure: Buy lower-strike call + sell higher-strike call
Outlook: Moderately bullish
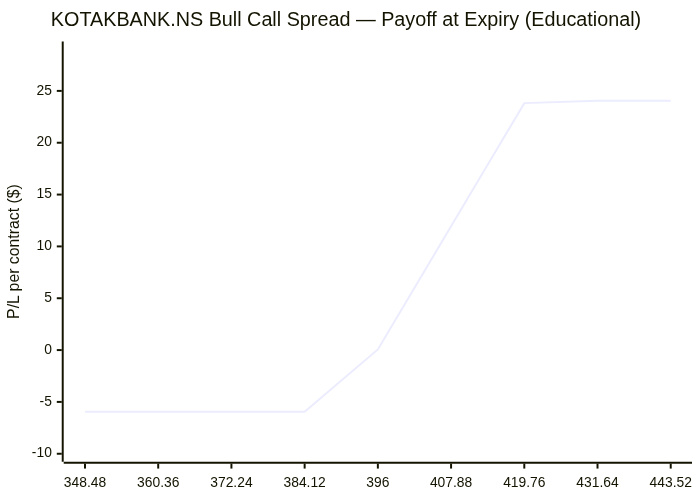
Entry zone: ~396 · Target: ~420 · Stop: ~373.37 · Breakeven: ~395.94
Risk note: Defined risk equals net debit; reward is capped between the two call strikes.
Payoff chart (Mermaid):
Entry / exit map (Mermaid):

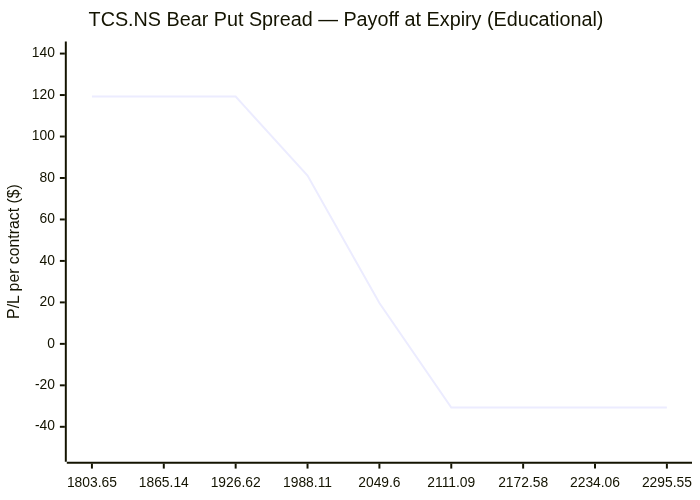
TCS.NS: Bear Put Spread
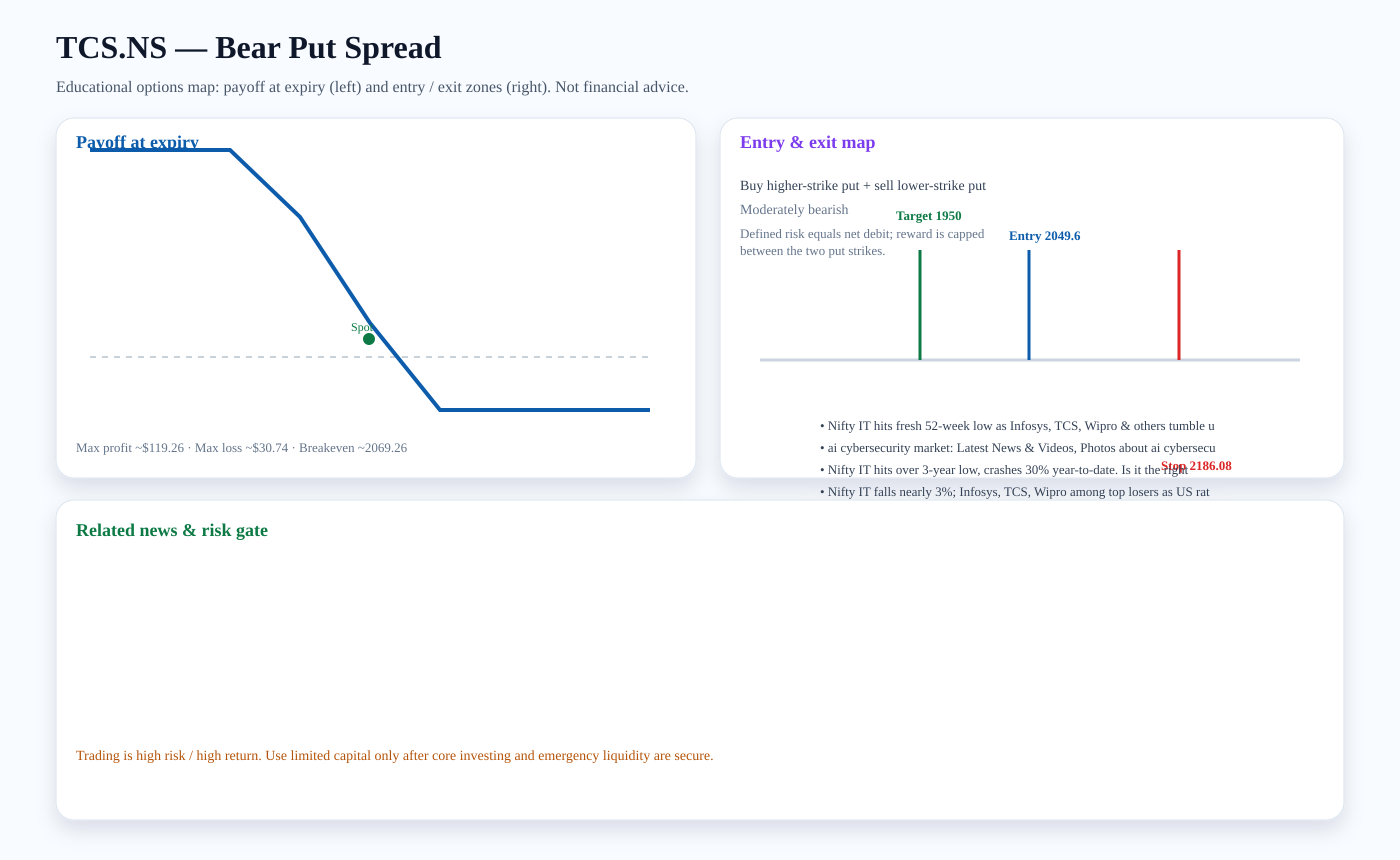
Structure: Buy higher-strike put + sell lower-strike put
Outlook: Moderately bearish
Entry zone: ~2049.6 · Target: ~1950 · Stop: ~2186.08 · Breakeven: ~2069.26
Risk note: Defined risk equals net debit; reward is capped between the two put strikes.
Related news links:
Payoff chart (Mermaid):
Entry / exit map (Mermaid):

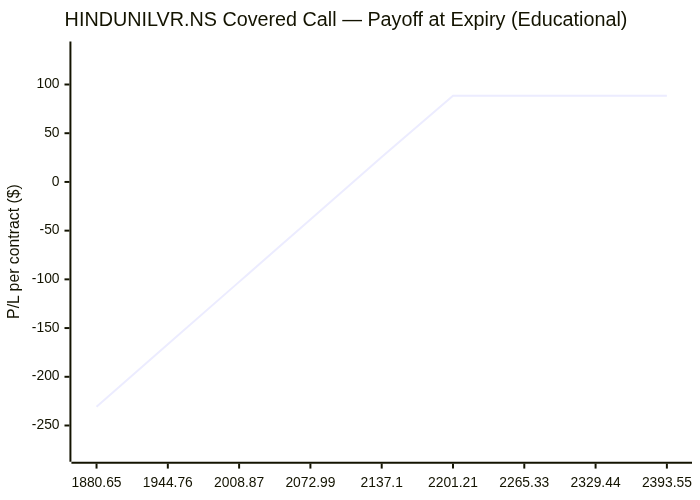
HINDUNILVR.NS: Covered Call
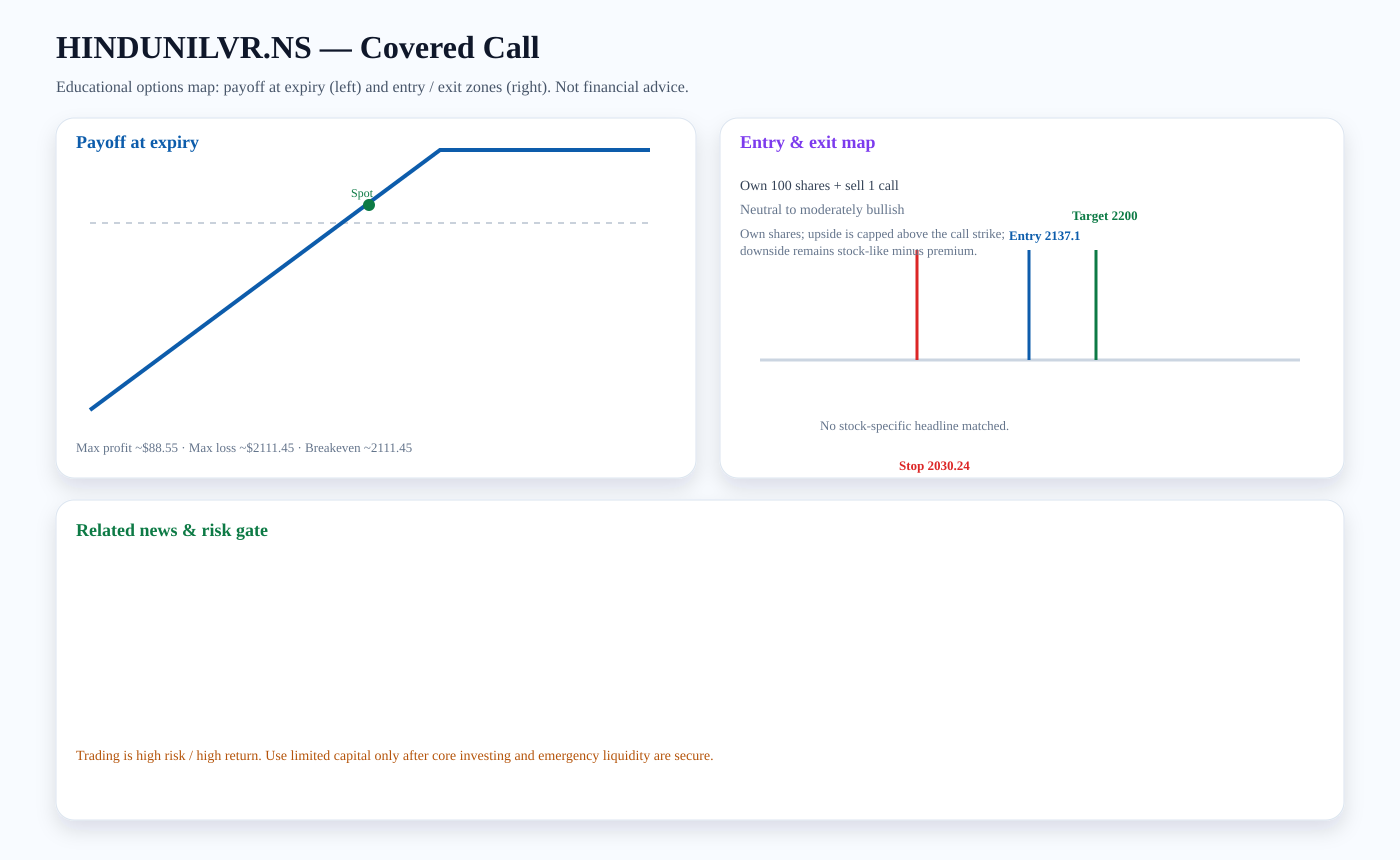
Structure: Own 100 shares + sell 1 call
Outlook: Neutral to moderately bullish
Entry zone: ~2137.1 · Target: ~2200 · Stop: ~2030.24 · Breakeven: ~2111.45
Risk note: Own shares; upside is capped above the call strike; downside remains stock-like minus premium.
Payoff chart (Mermaid):
Entry / exit map (Mermaid):

Trading versus investing
Investing focuses on durable ownership, diversification, and compounding. Trading seeks faster tactical returns and carries higher risk. We treat options trading as limited-capital, educational analysis only after core investment capital and emergency liquidity are protected.
PDF report — Premium
Premium members get the full PDF attached to email briefs and can download it here. Upgrade for just $2 a month.
Subscribe for $2/month