
India (NSE) Market Intelligence Brief
Report as-of (US/Eastern): 2026-07-02 05:30:24 EDT
Data sources: NSE pre-open F&O and NSE derivatives quotes
Executive summary
Report as-of (US/Eastern): 2026-07-02 05:30:24 EDT
NSE pre-open session shows strong momentum in IT sector leaders, with INFY (+5.45%) and TCS (+4.16%) leading a broad-based recovery after a 4-day decline. Banking names ICICIBANK (+1.39%) and SBIN (+0.39%) continue monthly uptrends, while defensive FMCG play HINDUNILVR (+1.33%) maintains steady gains. The IT sector rebound appears driven by oversold conditions and potential sector rotation, though broader index data remains unavailable.
Data sources: NSE pre-open F&O page and NSE official derivatives quote pages
Index & F&O pre-open regime
No NSE index data retrieved – Unable to assess NIFTY, BANKNIFTY, or MIDCPNIFTY pre-open conditions due to data limitations. This creates uncertainty around broader market direction despite individual stock strength.
Largest movers by percentage
Large cap
- INFY.NS: ₹1039.0 (+5.45%) – Leading IT sector recovery
- TCS.NS: ₹2065.0 (+4.16%) – Strong bounce from recent weakness
- ICICIBANK.NS: ₹1399.0 (+1.39%) – Continuing monthly uptrend (+12.64%)
- HINDUNILVR.NS: ₹2211.1 (+1.33%) – Defensive FMCG strength
- SBIN.NS: ₹1051.5 (+0.39%) – Banking sector momentum
Mid cap
No NSE pre-open movers found
Small cap (High risk — proceed with caution)
No NSE pre-open movers found
Important: Small-cap investments carry significant liquidity and volatility risks. Use limited risk capital only after securing core portfolio investments.
Related news drivers
- IT Sector Rebound: Nifty IT index gaining 4% after 4-day decline, with INFY and TCS surging 3-5%
- AI Infrastructure Concerns: Chipmaker weakness and AI cost pressures creating sector volatility
- Apple Supply Chain: Cybersecurity breach at Apple's India partner and negotiations with blacklisted Chinese chipmakers amid AI-driven memory shortage
- Semiconductor Momentum: Micron leading $2T AI-led chip rally with 1,200% earnings growth
NSE options structure ideas (educational)
Primary Focus: IT Sector Calls
INFY.NS and TCS.NS present the strongest bullish setups given +5.45% and +4.16% gaps respectively, supported by sector-wide recovery momentum.
INFY.NS Primary Structure:
- Call debit spread: Long 1040/Short 1080 calls (July expiry)
- Put alternative: Cash-secured puts at 1000 strike for pullback entry
TCS.NS Primary Structure:
- Call debit spread: Long 2070/Short 2120 calls
- Risk management: Protective puts if gap-fade occurs
Secondary Banking Plays
ICICIBANK.NS (+12.64% monthly trend) and SBIN.NS (+8.35% monthly) offer call spreads around current levels with put-selling opportunities on any weakness.
Critical Limitation: NSE options chain data unavailable due to connection timeouts – verify bid/ask spreads and liquidity before execution.
Risks & watch-outs
- Data Gaps: No index data or options chain visibility limits comprehensive analysis
- Gap Risk: Strong pre-open moves may reverse if broader market weakens
- IT Sector Volatility: Monthly downtrends in INFY (-13.18%) and TCS (-7.88%) suggest today's bounce could be temporary
- Liquidity Concerns: Unable to assess options market depth due to NSE connection issues
- Small-cap Caution: No small-cap data available, but any small-cap positions should use minimal risk capital given inherent liquidity constraints
- Sector Rotation Risk: AI/chip sector weakness could spill over to Indian IT exporters
Key Watch: Monitor if IT sector strength sustains beyond pre-open session and whether broader indices confirm the positive momentum.
Visual strategy maps
Payoff curves and entry/exit zones below are educational aids — not trade instructions. Confirm with your own chart, liquidity, and risk limits.
INFY.NS: Bull Call Spread
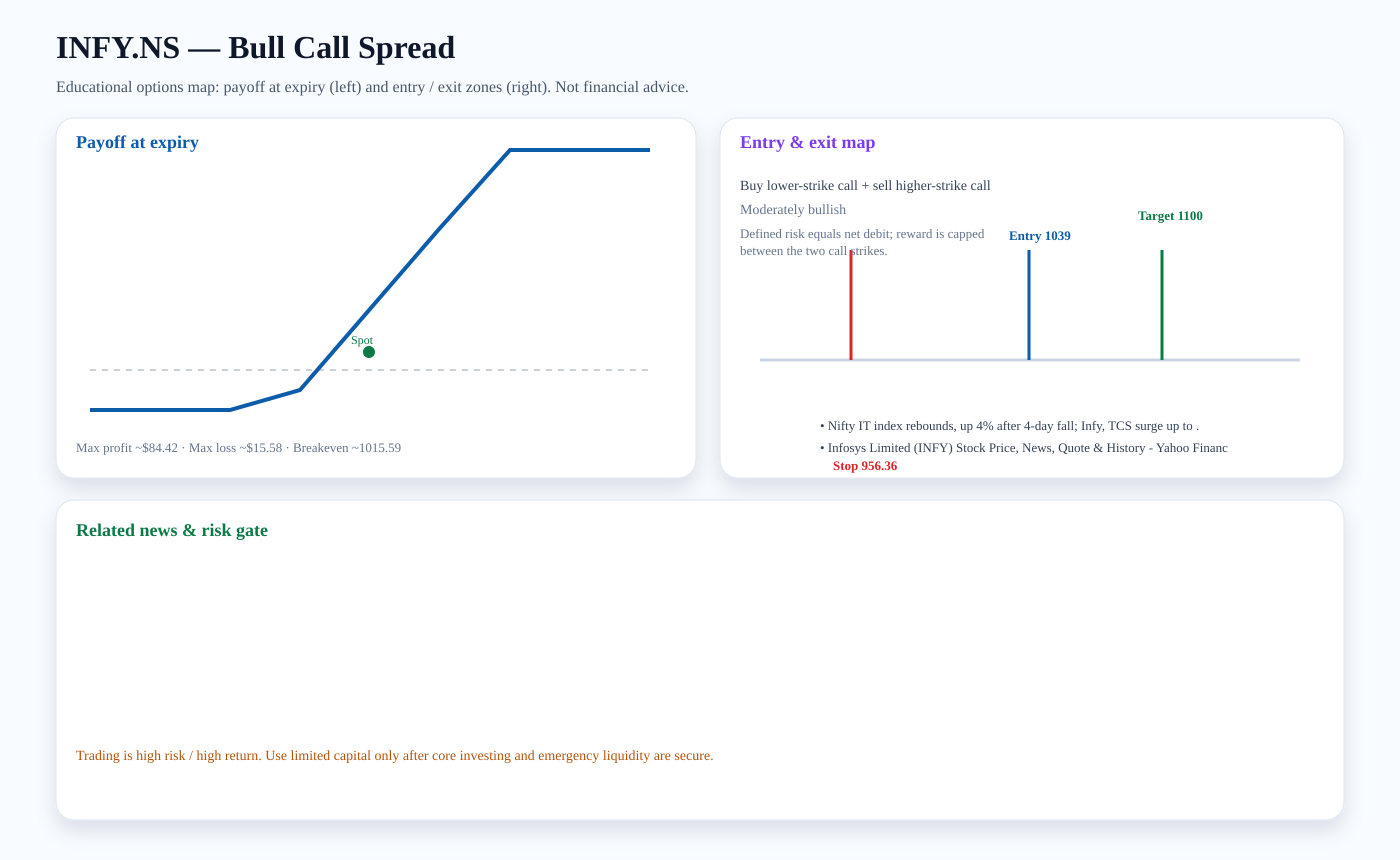
Structure: Buy lower-strike call + sell higher-strike call
Outlook: Moderately bullish
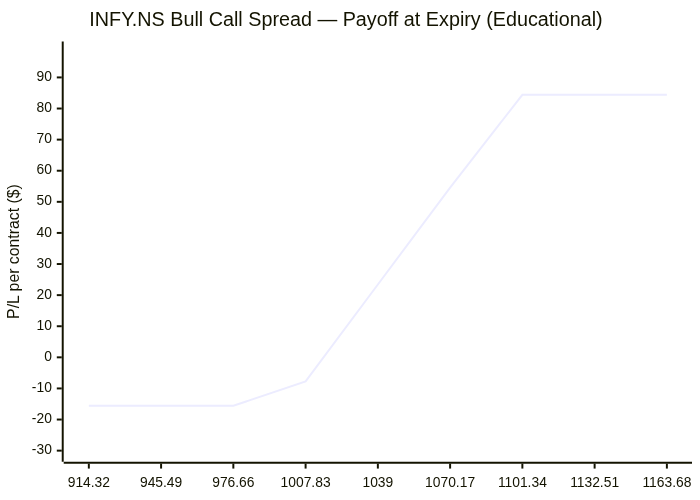
Entry zone: ~1039 · Target: ~1100 · Stop: ~956.36 · Breakeven: ~1015.59
Risk note: Defined risk equals net debit; reward is capped between the two call strikes.
Related news links:
Payoff chart (Mermaid):
Entry / exit map (Mermaid):

TCS.NS: Bull Call Spread
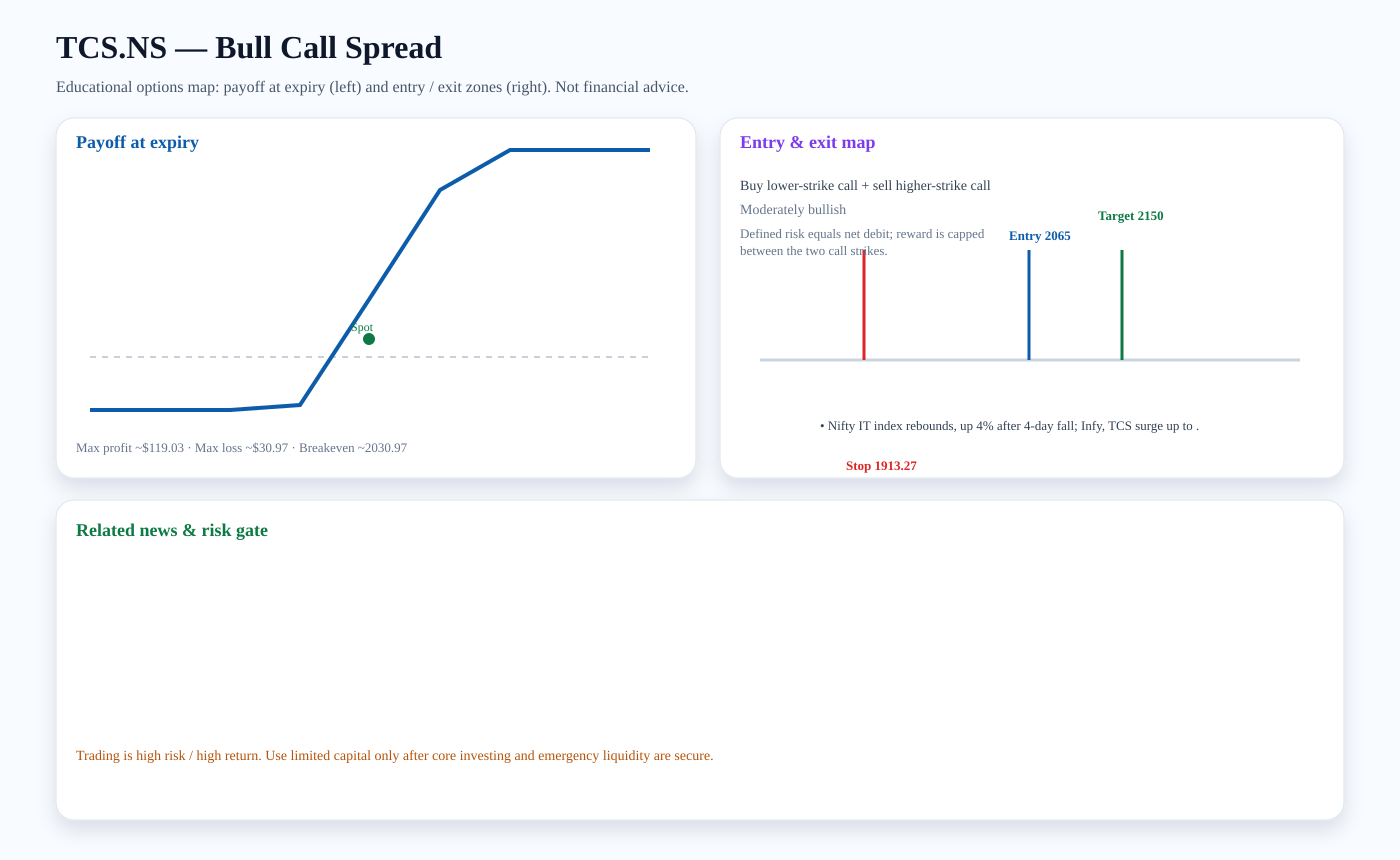
Structure: Buy lower-strike call + sell higher-strike call
Outlook: Moderately bullish
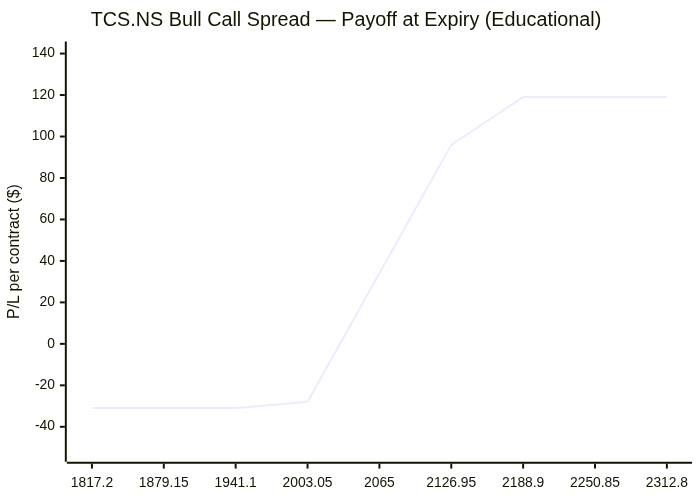
Entry zone: ~2065 · Target: ~2150 · Stop: ~1913.27 · Breakeven: ~2030.97
Risk note: Defined risk equals net debit; reward is capped between the two call strikes.
Related news links:
Payoff chart (Mermaid):
Entry / exit map (Mermaid):

ICICIBANK.NS: Covered Call
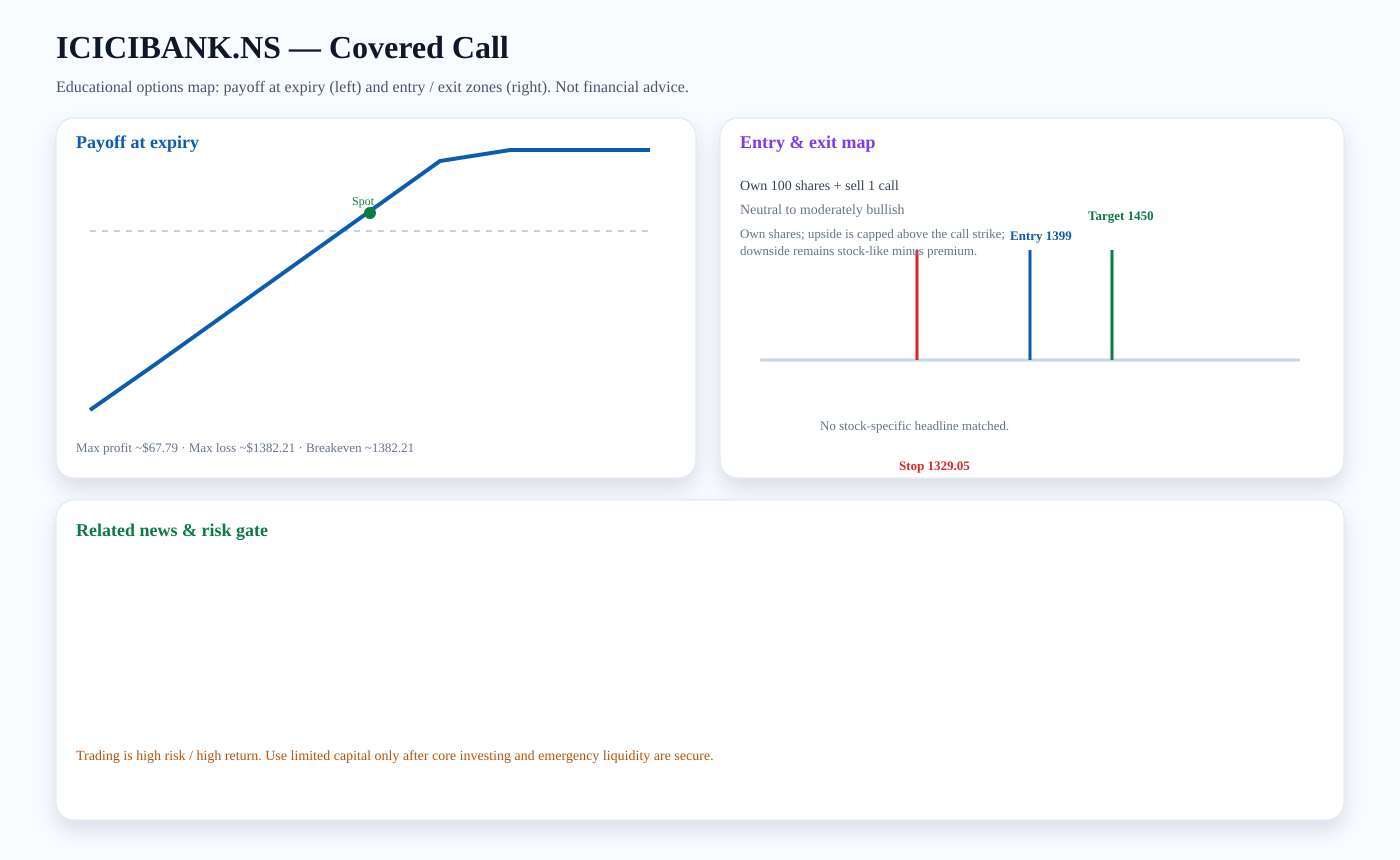
Structure: Own 100 shares + sell 1 call
Outlook: Neutral to moderately bullish
Entry zone: ~1399 · Target: ~1450 · Stop: ~1329.05 · Breakeven: ~1382.21
Risk note: Own shares; upside is capped above the call strike; downside remains stock-like minus premium.
Payoff chart (Mermaid):
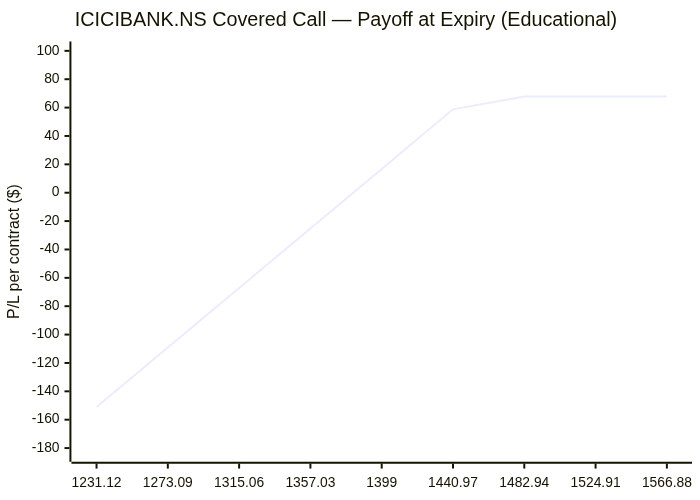
Entry / exit map (Mermaid):

HINDUNILVR.NS: Bull Call Spread
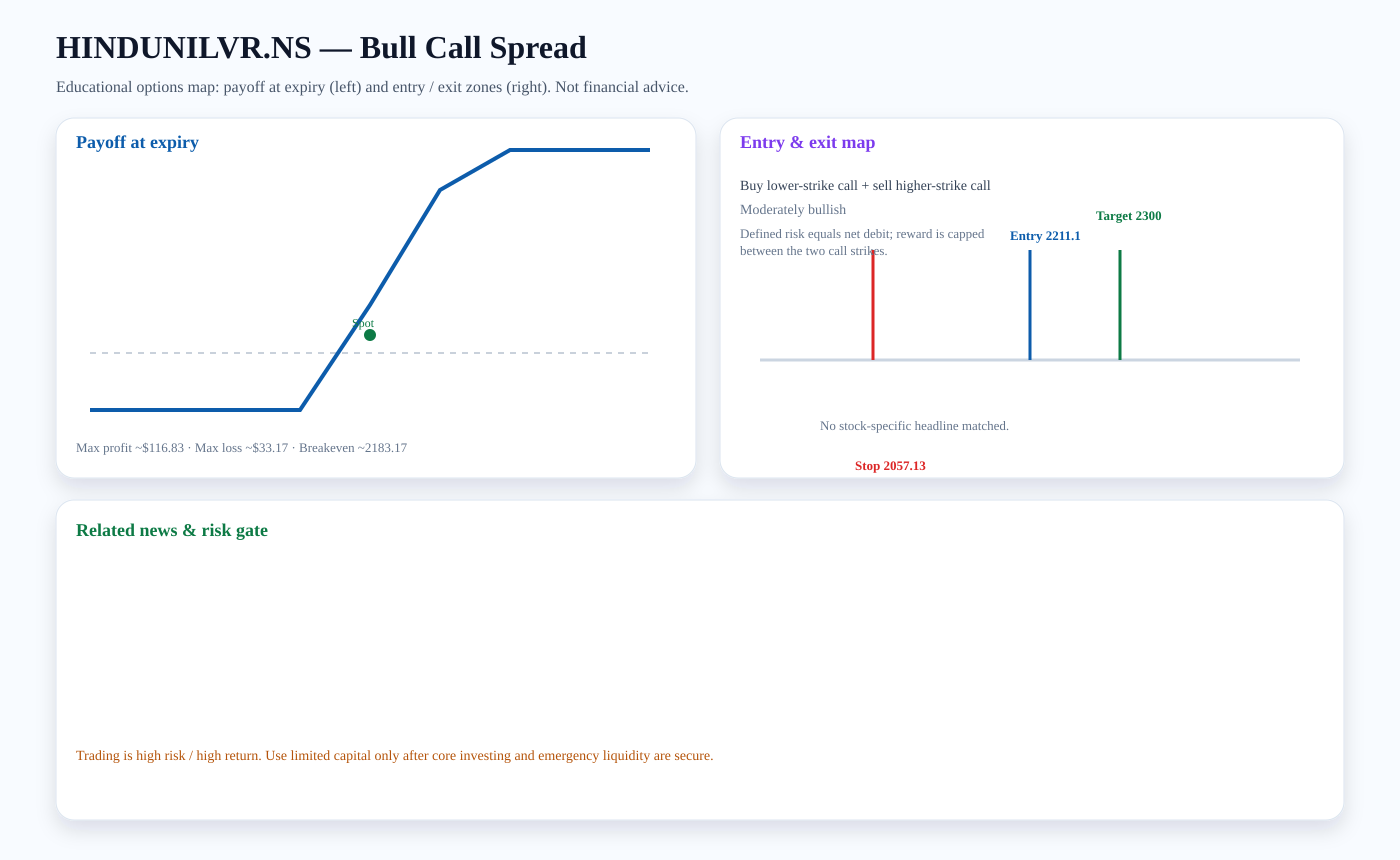
Structure: Buy lower-strike call + sell higher-strike call
Outlook: Moderately bullish
Entry zone: ~2211.1 · Target: ~2300 · Stop: ~2057.13 · Breakeven: ~2183.17
Risk note: Defined risk equals net debit; reward is capped between the two call strikes.
Payoff chart (Mermaid):
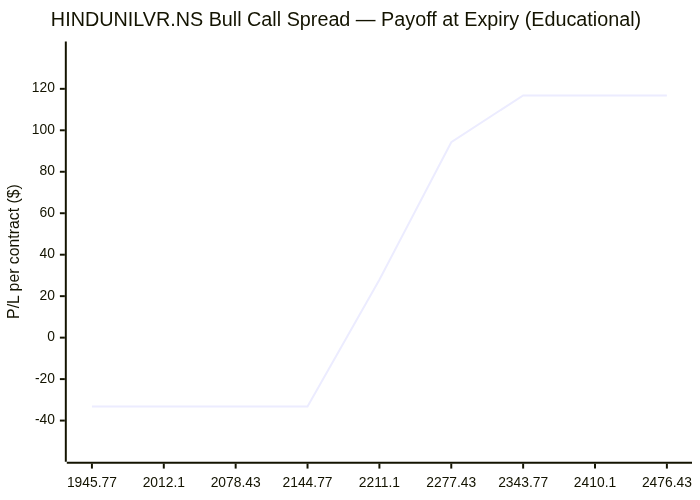
Entry / exit map (Mermaid):

Trading versus investing
Investing focuses on durable ownership, diversification, and compounding. Trading seeks faster tactical returns and carries higher risk. We treat options trading as limited-capital, educational analysis only after core investment capital and emergency liquidity are protected.
PDF report — Premium
Premium members get the full PDF attached to email briefs and can download it here. Upgrade for just $2 a month.
Subscribe for $2/month