
India (NSE) Market Intelligence Brief
Report as-of (US/Eastern): 2026-07-02 23:18:33 EDT
Data sources: NSE pre-open F&O and NSE derivatives quotes
Executive summary
Report as-of (US/Eastern): 2026-07-02 23:18:33 EDT
Indian IT sector leads pre-open recovery with INFY (+5.64%) and TCS (+4.31%) spearheading a sector-wide rebound after a 4-day decline. Banking names show mixed performance with ICICIBANK (+1.46%) outperforming SBIN (+0.40%). The IT index's +4.6% surge follows a 17% decline over 20 sessions, suggesting potential oversold bounce. Options structures favor call-side positioning on IT names given strong sector momentum, while banking presents selective opportunities.
*Data sources: NSE pre-open F&O page and NSE official derivatives quote pages*
Index & F&O pre-open regime
No NSE index data retrieved – Official NSE derivative index trends unavailable at report time due to data connection issues.
Key F&O constituents showing:
- IT sector leadership: INFY (+5.64%), TCS (+4.31%) driving sector recovery
- Banking mixed: ICICIBANK (+1.46%) vs SBIN (+0.40%)
- Consumer staples steady: HINDUNILVR (+1.31%)
Largest movers by %
Large cap
- INFY.NS: ₹1,040.9 (+5.64%) – Leading IT sector rebound
- TCS.NS: ₹2,068.1 (+4.31%) – Strong sector recovery momentum
- ICICIBANK.NS: ₹1,400.0 (+1.46%) – Outperforming banking peers
- HINDUNILVR.NS: ₹2,210.6 (+1.31%) – Steady consumer staples performance
- SBIN.NS: ₹1,051.6 (+0.40%) – Modest banking sector gains
Mid cap
No NSE pre-open movers found in mid-cap segment.
Small cap (high risk — proceed with caution)
No NSE pre-open movers found in small-cap segment.
⚠️ Small-cap caution: Small-cap stocks carry high risk due to liquidity constraints and volatility. Investors should proceed with extreme caution and allocate only limited risk capital after securing core portfolio investments.
Related news drivers
IT Sector Recovery Theme:
- Nifty IT index rebounds +4.6% after 4-day slide, with Infosys, Tech Mahindra, and TCS leading recovery
- IT index had declined 17% over past 20 trading sessions, creating oversold bounce conditions
- Mixed global tech cues with some stabilization after AI-driven selloff concerns
Global Tech Context:
- Chip stocks have surged 157% over past year, though hyperscalers may catch up to AI chip winners
- European shares hit record highs after softer US jobs data calmed rate hike fears
- Stocks stabilizing after tech-led selloff fueled by AI rally concerns
NSE options structure ideas (educational)
INFY.NS – Primary: CALL
*Trend: 1W -0.03% | 1M -13.02% | Current +5.64%*
Call-side (Primary): Call debit spread (Buy 1050/Sell 1100) targeting sector momentum continuation above current 1040.9 level. IT sector oversold bounce from 17% decline supports bullish bias.
Put-side: Cash-secured puts at 1000 strike for pullback entry or protective puts at 1020 for existing holders.
TCS.NS – Primary: CALL
*Trend: 1W -1.27% | 1M -7.74% | Current +4.31%*
Call-side (Primary): Call debit spread (Long 2100/Short 2150) capturing IT sector leadership theme with defined risk structure.
Put-side: Cash-secured puts at 2000 strike only if seeking entry on sector pullback.
ICICIBANK.NS – Primary: CALL
*Trend: 1W +0.9% | 1M +12.72% | Current +1.46%*
Call-side (Primary): Call debit spread (Buy 1400/Sell 1450) leveraging strong monthly momentum (+12.72%) and banking sector outperformance.
Put-side: Cash-secured puts at 1350-1370 for pullback entry positioning.
⚠️ Options Data Limitation: NSE options chain data unavailable due to connection timeout. Verify current strikes, premiums, and liquidity directly on NSE derivatives platform before execution.
Risks & watch-outs
Market Structure Risks:
- IT sector bounce may be temporary if global tech sentiment deteriorates
- Monthly downtrends in IT names (-13.02% INFY, -7.74% TCS) could reassert
- Banking sector mixed signals require selective positioning
Options-Specific Risks:
- Data connectivity issues: NSE options chain verification required before trading
- Liquidity concerns: Verify bid/ask spreads, especially on higher-priced names (HINDUNILVR ₹2,210+)
- Gap risk: Pre-open moves may gap at market open, affecting option pricing
Small-cap & Liquidity Warnings:
- No small-cap movers identified, but any small-cap options carry extreme liquidity risk
- Gap risk amplified in smaller names with wider spreads
- Limited risk capital only – secure core investments before speculative positioning
*All options structures are educational only and not investment advice. Consult NSE official derivatives data and qualified advisors before trading.*
Visual strategy maps
Payoff curves and entry/exit zones below are educational aids — not trade instructions. Confirm with your own chart, liquidity, and risk limits.
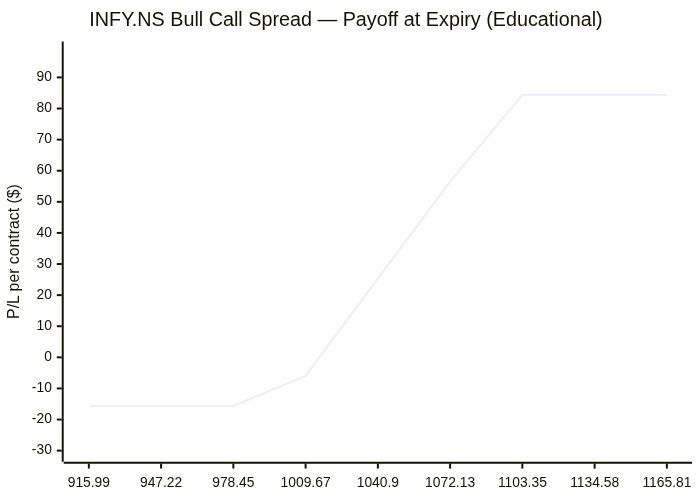
INFY.NS: Bull Call Spread
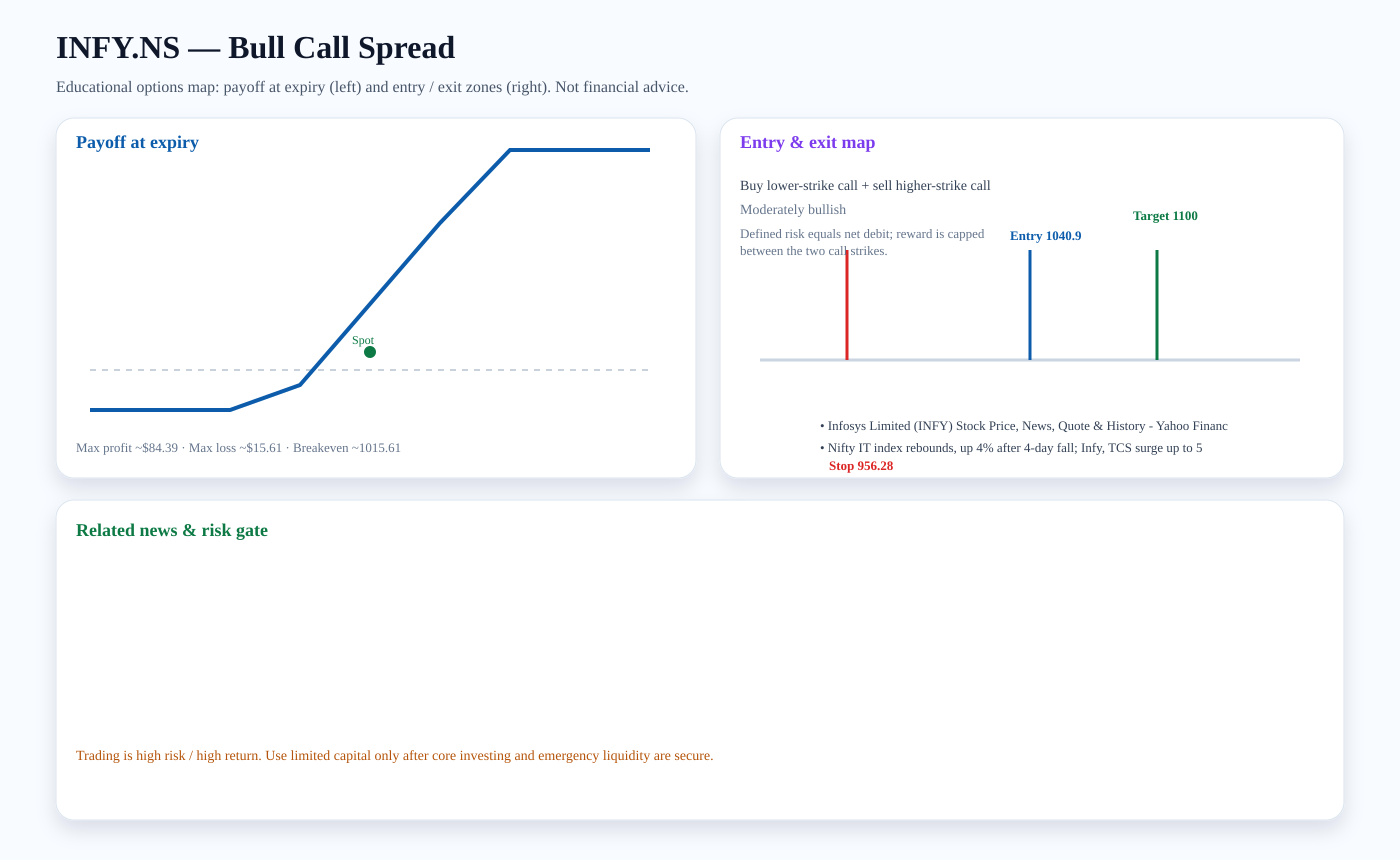
Structure: Buy lower-strike call + sell higher-strike call
Outlook: Moderately bullish
Entry zone: ~1040.9 · Target: ~1100 · Stop: ~956.28 · Breakeven: ~1015.61
Risk note: Defined risk equals net debit; reward is capped between the two call strikes.
Related news links:
Payoff chart (Mermaid):
Entry / exit map (Mermaid):

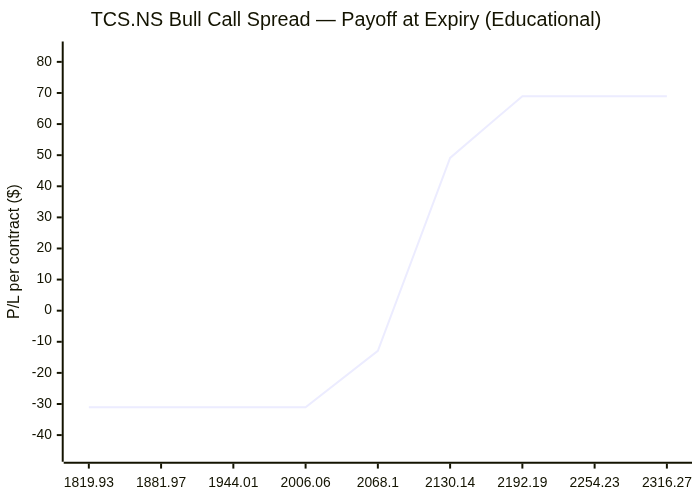
TCS.NS: Bull Call Spread
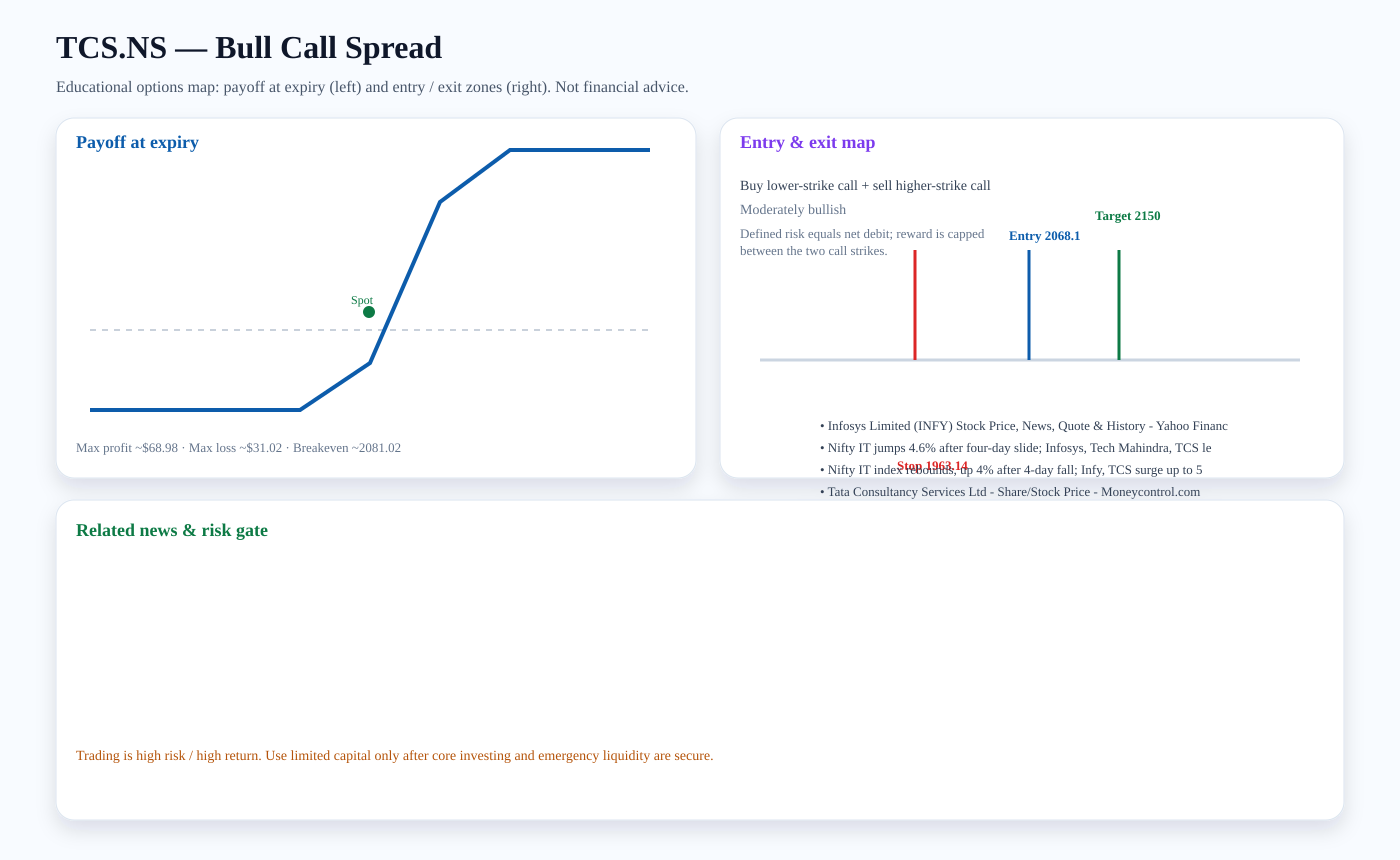
Structure: Buy lower-strike call + sell higher-strike call
Outlook: Moderately bullish
Entry zone: ~2068.1 · Target: ~2150 · Stop: ~1963.14 · Breakeven: ~2081.02
Risk note: Defined risk equals net debit; reward is capped between the two call strikes.
Related news links:
Payoff chart (Mermaid):
Entry / exit map (Mermaid):

ICICIBANK.NS: Bull Call Spread
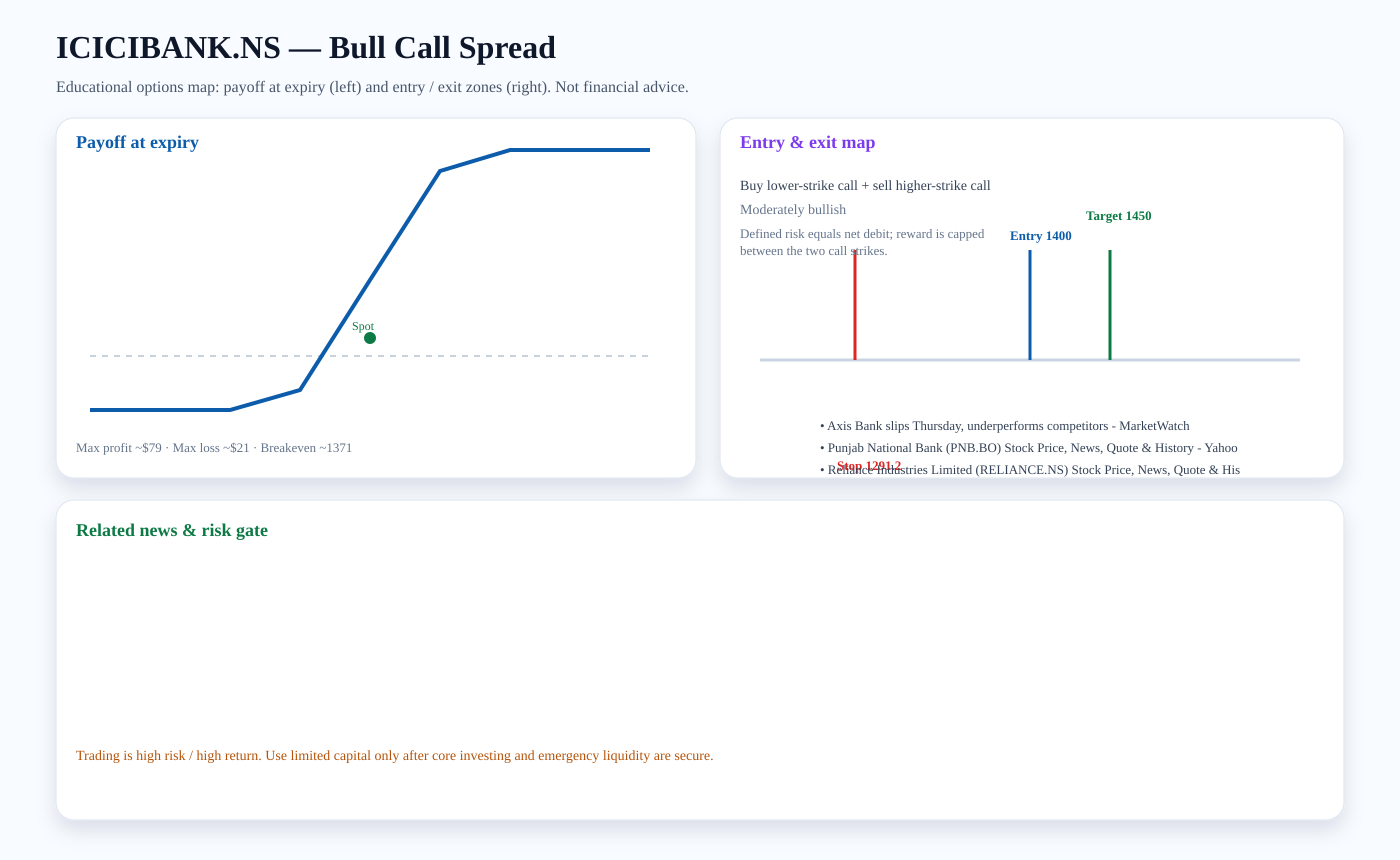
Structure: Buy lower-strike call + sell higher-strike call
Outlook: Moderately bullish
Entry zone: ~1400 · Target: ~1450 · Stop: ~1291.2 · Breakeven: ~1371
Risk note: Defined risk equals net debit; reward is capped between the two call strikes.
Related news links:
Payoff chart (Mermaid):
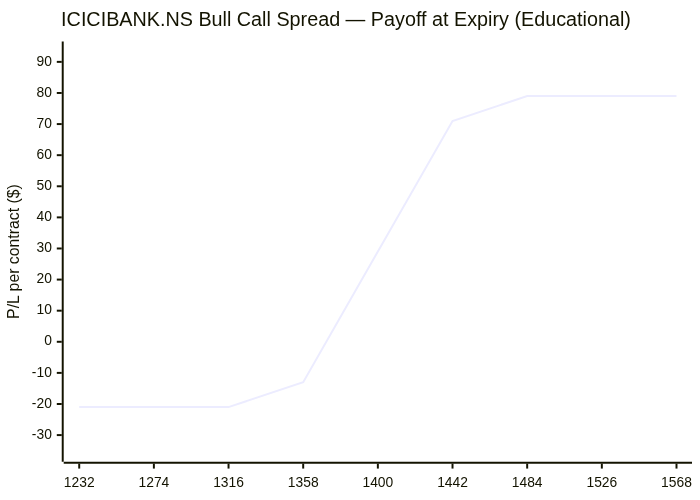
Entry / exit map (Mermaid):

HINDUNILVR.NS: Bull Call Spread
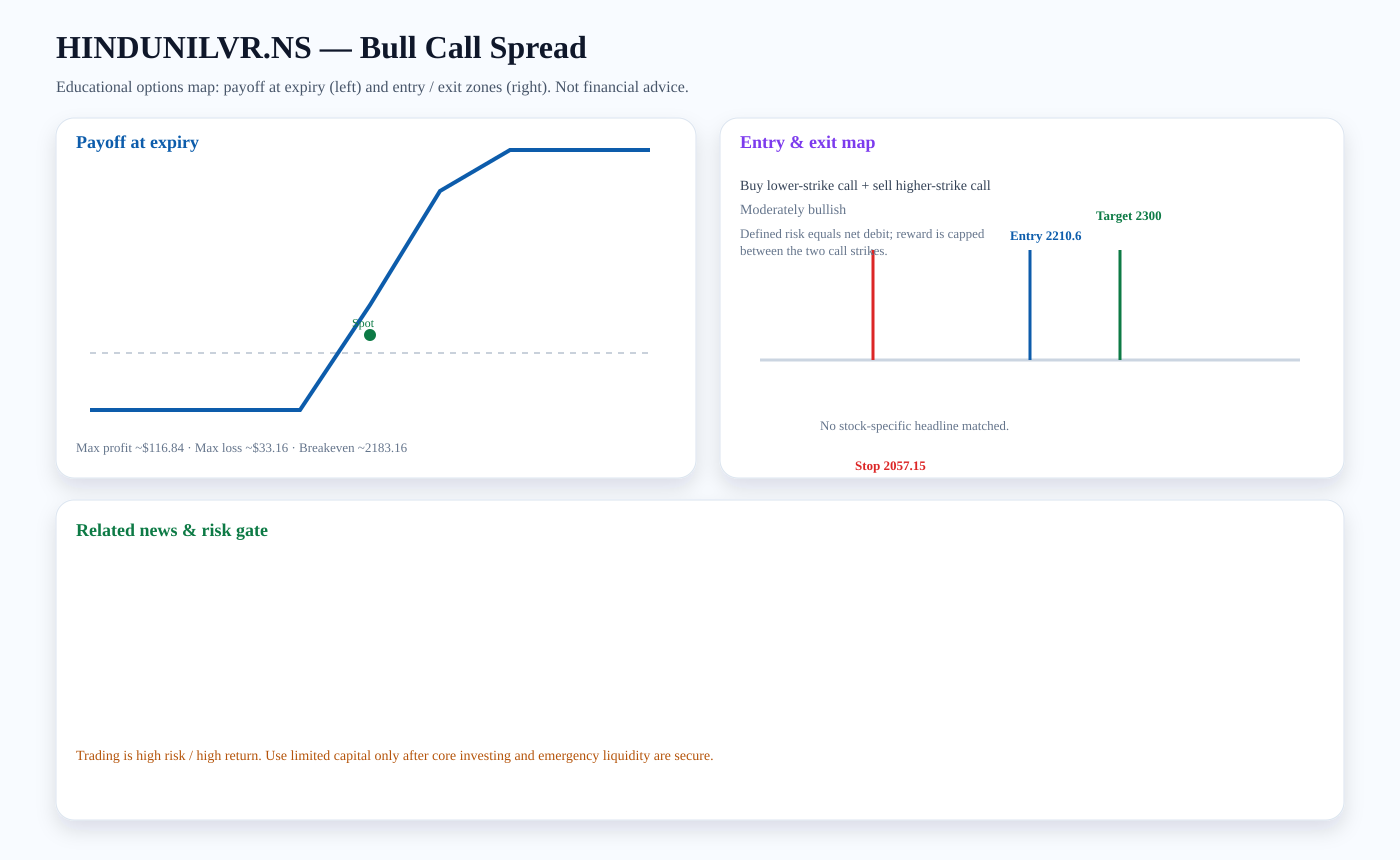
Structure: Buy lower-strike call + sell higher-strike call
Outlook: Moderately bullish
Entry zone: ~2210.6 · Target: ~2300 · Stop: ~2057.15 · Breakeven: ~2183.16
Risk note: Defined risk equals net debit; reward is capped between the two call strikes.
Payoff chart (Mermaid):
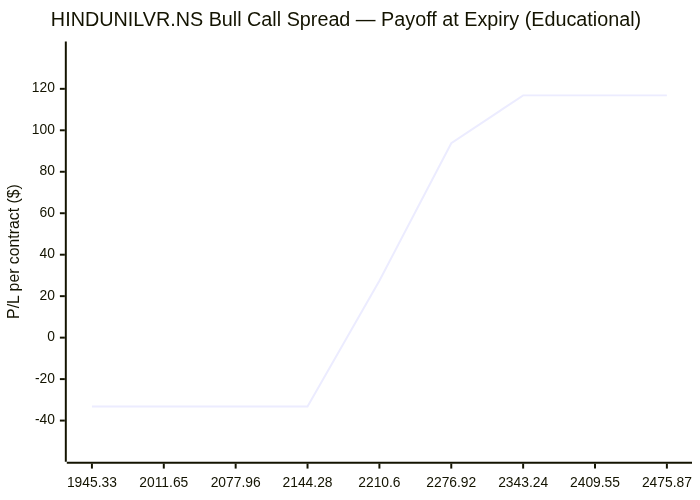
Entry / exit map (Mermaid):

Trading versus investing
Investing focuses on durable ownership, diversification, and compounding. Trading seeks faster tactical returns and carries higher risk. We treat options trading as limited-capital, educational analysis only after core investment capital and emergency liquidity are protected.
PDF report — Premium
Premium members get the full PDF attached to email briefs and can download it here. Upgrade for just $2 a month.
Subscribe for $2/month