
India (NSE) Market Intelligence Brief
Report as-of (US/Eastern): 2026-07-09 23:45:35 EDT
Data sources: NSE pre-open F&O and NSE derivatives quotes
Executive summary
Report as-of (US/Eastern): 2026-07-09 23:45:35 EDT
NSE pre-open F&O data shows mixed but generally positive sentiment across major Indian equities. IT giants TCS (+3.18%) and Infosys (+2.93%) lead gains, potentially signaling sector rotation ahead of Q1 results. Banking heavyweight ICICI Bank (+1.60%) and conglomerate Reliance (+1.38%) add to bullish momentum, while telecom leader Bharti Airtel (-0.98%) provides the sole decline among tracked names. Pre-market strength in IT stocks contrasts with recent reports of TCS trading near 6-year lows, suggesting possible earnings optimism or oversold bounce conditions.
Data sources: NSE pre-open F&O page and NSE official derivatives quote pages
Index & F&O pre-open regime (NIFTY, BANKNIFTY, MIDCPNIFTY, etc.)
No NSE index data retrieved – Official NSE derivative index trends unavailable at report time. Unable to assess broader market regime for NIFTY, BANKNIFTY, MIDCPNIFTY, or other key indices. Individual stock movements suggest cautiously optimistic sentiment, but lack of index context limits regime assessment.
Largest movers by percentage
Large cap
- TCS.NS: +3.18% to ₹2,114.7 (IT services)
- INFY.NS: +2.93% to ₹1,081.6 (IT services)
- ICICIBANK.NS: +1.60% to ₹1,402.8 (Private banking)
- RELIANCE.NS: +1.38% to ₹1,297.4 (Conglomerate)
- BHARTIARTL.NS: -0.98% to ₹1,912.1 (Telecommunications)
Mid cap
No NSE pre-open mid-cap movers found in available data.
Small cap (high risk — proceed with caution)
No NSE pre-open small-cap movers found in available data.
⚠️ Small-cap caution: Small-cap stocks carry significantly higher risk due to limited liquidity, wider bid-ask spreads, and elevated volatility. Investors should proceed with extreme caution and allocate only limited risk capital after securing core portfolio investments.
Related news drivers
IT Sector Focus:
- TCS trading near 6-year lows ahead of Q1 results, with stock showing 2% decline recently before today's pre-market recovery
- Mixed sentiment around IT sector performance with earnings season approaching
Global Technology Volatility:
- Tech stock volatility hits 23-year high as Nasdaq swings outpace S&P 500
- AI sector experiencing significant momentum volatility, reaching 6-year highs
- Broadcom signals major market developments with $30 billion Apple chip deal
Broader Market Context:
- Global concerns around Japan bond crisis warnings from SocGen
- Technology sector experiencing significant structural shifts around AI positioning
NSE options structure ideas (educational; cite official chain context)
⚠️ Data Limitation: NSE options chain data unavailable due to connection timeouts. Structures below are educational frameworks only – verify current strikes, liquidity, and pricing before execution.
TCS.NS – Primary: CALL structures
Bullish bias on +3.18% pre-market gap and potential earnings catalyst
- Call debit spread: Long ATM ₹2,115 calls / Short ₹2,200-2,250 calls
- Put structure: Cash-secured puts at ₹2,000-2,050 support for income
- Risk: Earnings disappointment, high implied volatility crush
INFY.NS – Primary: CALL structures
Bullish bias on +2.93% move with positive weekly momentum (+3.28%)
- Call debit spread: Target ₹1,080-1,100 strikes for momentum continuation
- Put structure: Protective puts below ₹1,050 support
- Risk: Monthly downtrend (-2.96%) could reassert
ICICIBANK.NS – Primary: CALL structures
Bullish bias on strong monthly trend (+8.47%) and banking sector strength
- Call debit spread: Long ₹1,400 calls / Short ₹1,450 calls
- Put structure: Cash-secured puts at ₹1,350 support level
- Risk: Banking sector regulatory changes, currency fluctuation
RELIANCE.NS – Primary: CALL structures
Bullish bias on break above ₹1,300 psychological level
- Call debit spread: Long ₹1,300 calls / Short ₹1,320-1,340 calls
- Put structure: Cash-secured puts at ₹1,280 support
- Risk: Weekly downtrend (-0.51%) could continue despite bounce
BHARTIARTL.NS – Primary: PUT structures
Bearish bias on -0.98% decline despite strong monthly trend (+7.71%)
- Put debit spread: Long ₹1,910 puts / Short ₹1,890 puts
- Call structure: Call debit spread targeting bounce toward ₹1,930+
- Risk: Strong monthly uptrend could quickly reverse weakness
Risks & watch-outs
Market Structure Risks:
- NSE options chain data unavailable – verify liquidity and spreads before execution
- Pre-market moves may not sustain through regular trading hours
- Earnings season volatility could cause rapid reversals
Liquidity Concerns:
- Indian options markets typically have wider bid-ask spreads than US markets
- Small-cap options (if available) carry extreme liquidity risk and gap risk
- Verify open interest and volume before entering positions
Currency & Regulatory:
- INR volatility affects non-rupee traders
- Potential regulatory changes in banking and telecom sectors
- Global technology sector volatility spillover effects
Technical Risks:
- Mixed weekly/monthly trends across several names suggest consolidation phases
- TCS near 6-year lows creates both opportunity and continued downside risk
- Gap risk on earnings announcements, particularly for IT sector stocks
⚠️ Critical: This analysis is educational only. NSE options data limitations require independent verification of all strikes, pricing, and liquidity before any trading decisions.
Visual strategy maps
Payoff curves and entry/exit zones below are educational aids — not trade instructions. Confirm with your own chart, liquidity, and risk limits.
TCS.NS: Bull Call Spread
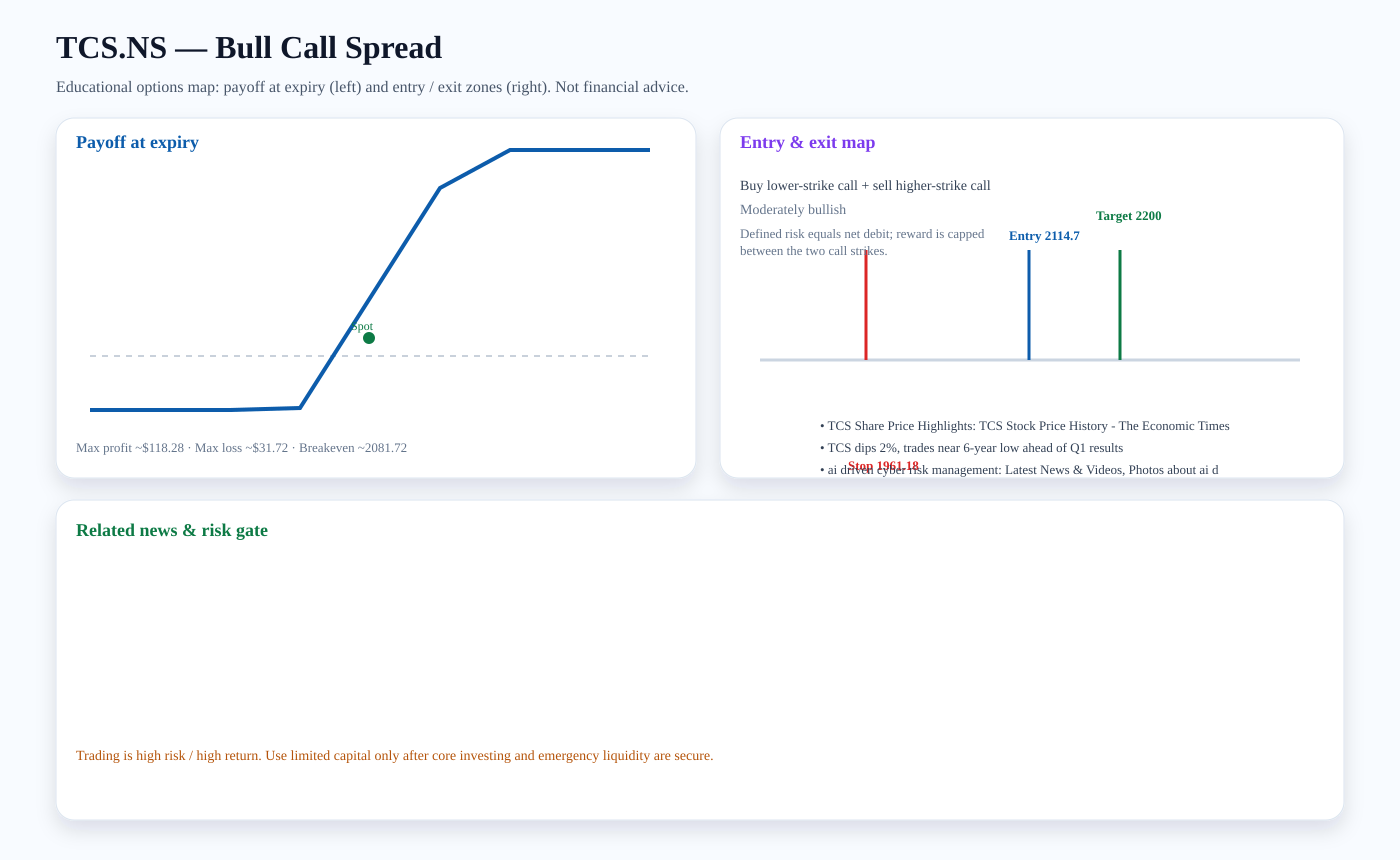
Structure: Buy lower-strike call + sell higher-strike call
Outlook: Moderately bullish
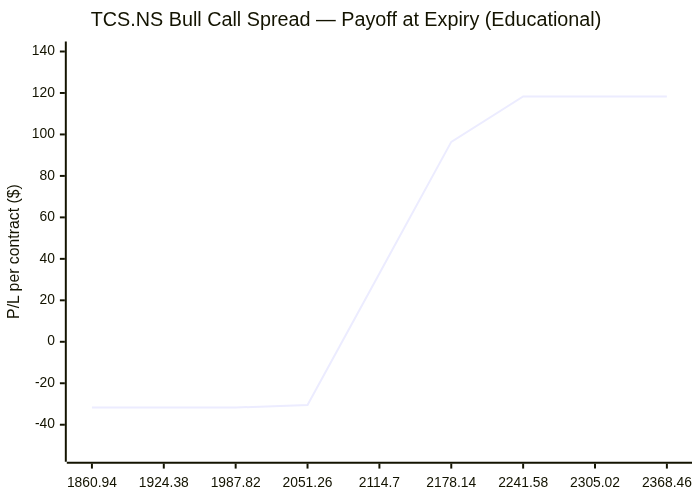
Entry zone: ~2114.7 · Target: ~2200 · Stop: ~1961.18 · Breakeven: ~2081.72
Risk note: Defined risk equals net debit; reward is capped between the two call strikes.
Related news links:
Payoff chart (Mermaid):
Entry / exit map (Mermaid):

INFY.NS: Bull Call Spread
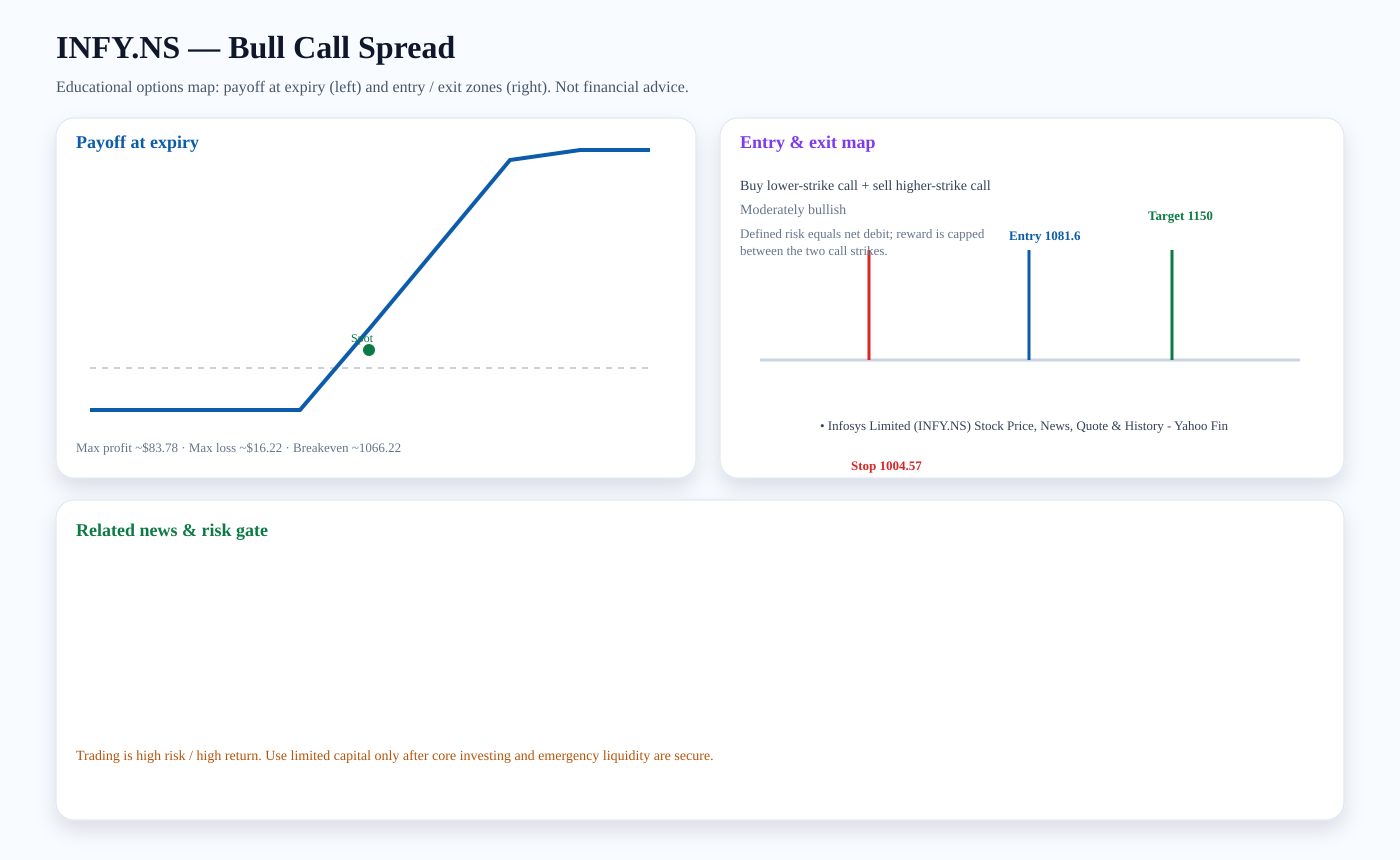
Structure: Buy lower-strike call + sell higher-strike call
Outlook: Moderately bullish
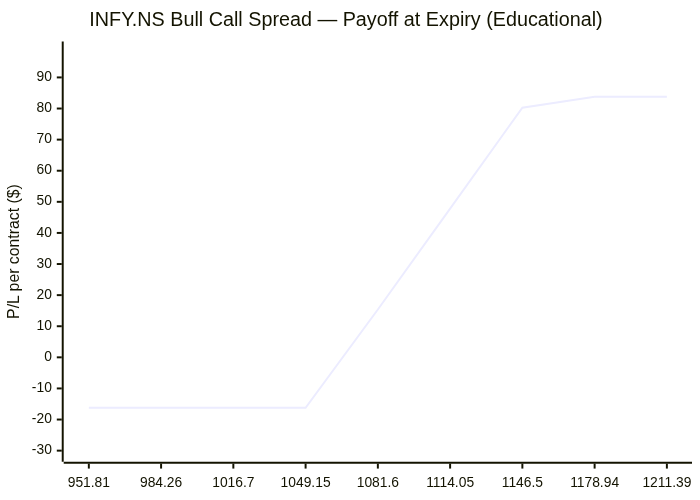
Entry zone: ~1081.6 · Target: ~1150 · Stop: ~1004.57 · Breakeven: ~1066.22
Risk note: Defined risk equals net debit; reward is capped between the two call strikes.
Related news links:
Payoff chart (Mermaid):
Entry / exit map (Mermaid):

ICICIBANK.NS: Bull Call Spread
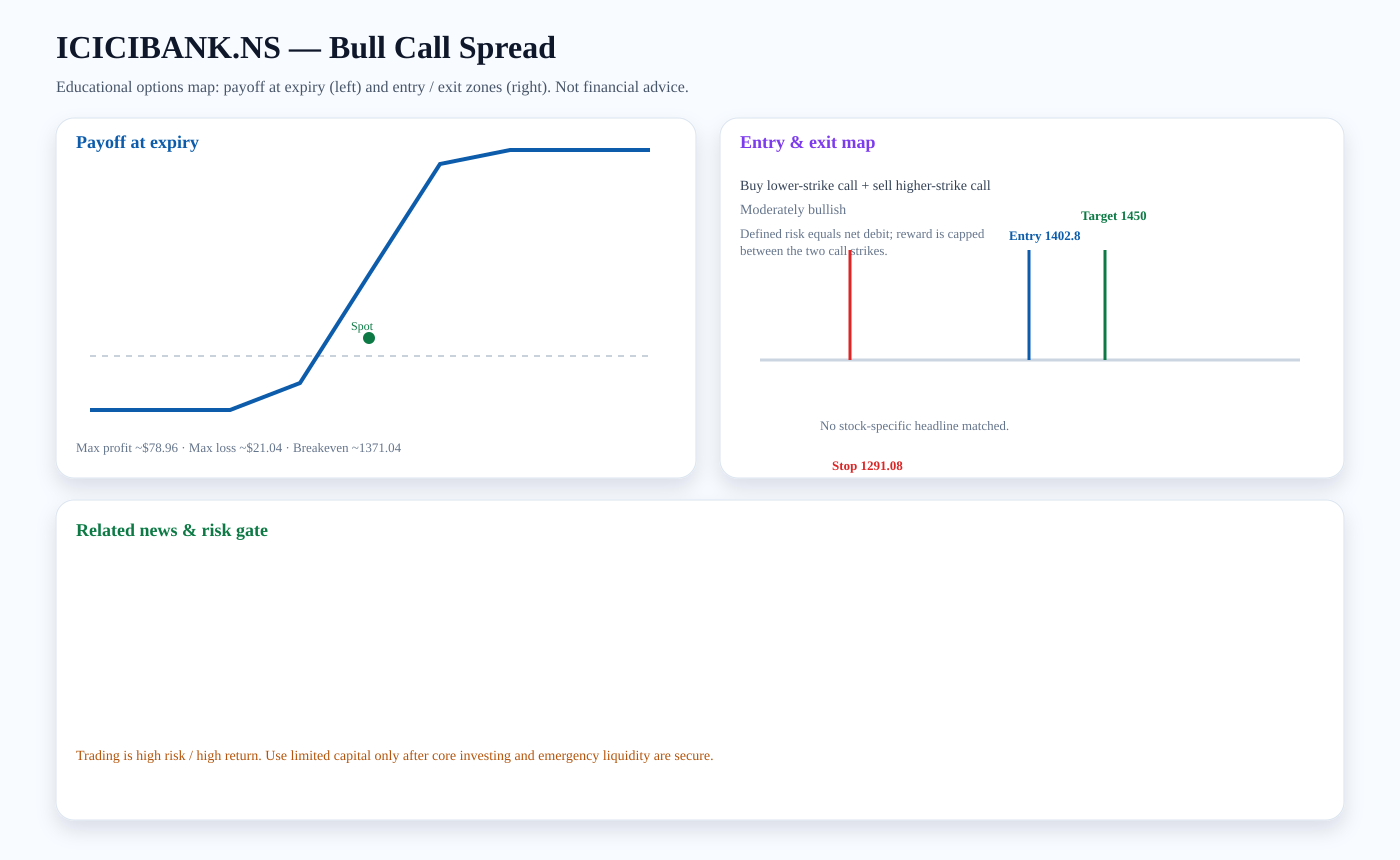
Structure: Buy lower-strike call + sell higher-strike call
Outlook: Moderately bullish
Entry zone: ~1402.8 · Target: ~1450 · Stop: ~1291.08 · Breakeven: ~1371.04
Risk note: Defined risk equals net debit; reward is capped between the two call strikes.
Payoff chart (Mermaid):
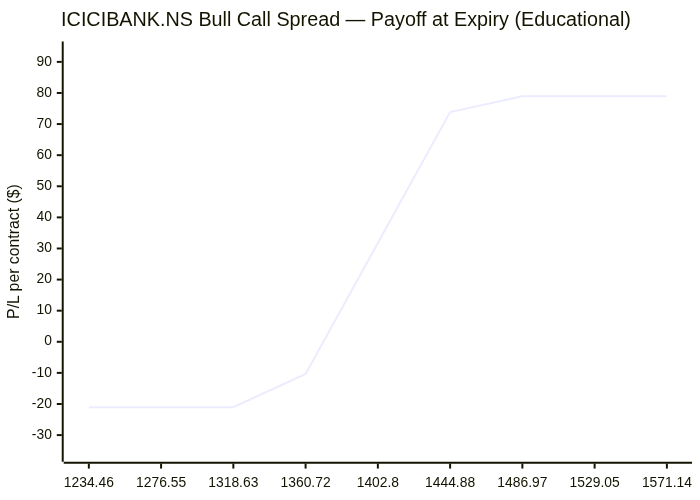
Entry / exit map (Mermaid):

RELIANCE.NS: Covered Call
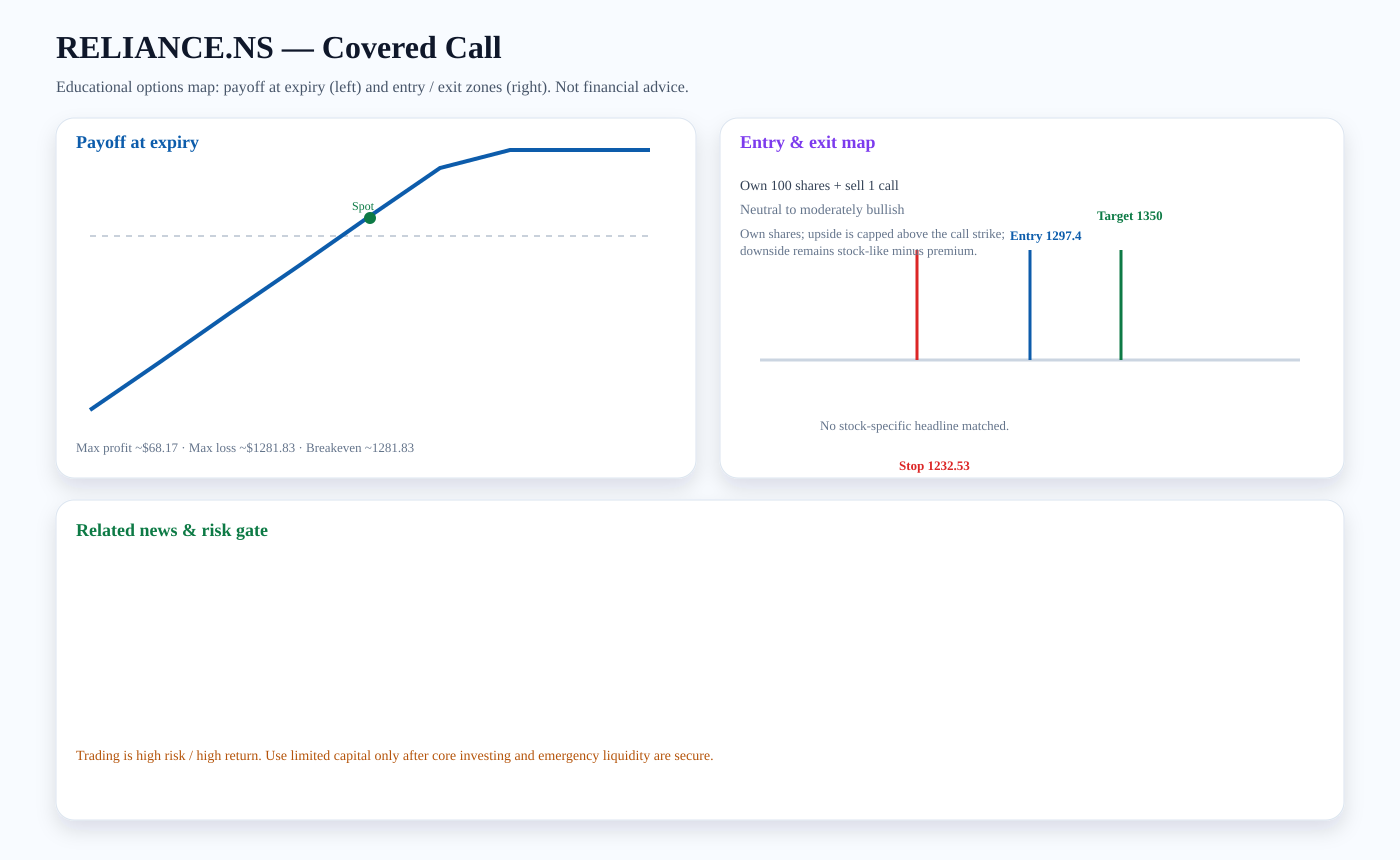
Structure: Own 100 shares + sell 1 call
Outlook: Neutral to moderately bullish
Entry zone: ~1297.4 · Target: ~1350 · Stop: ~1232.53 · Breakeven: ~1281.83
Risk note: Own shares; upside is capped above the call strike; downside remains stock-like minus premium.
Payoff chart (Mermaid):
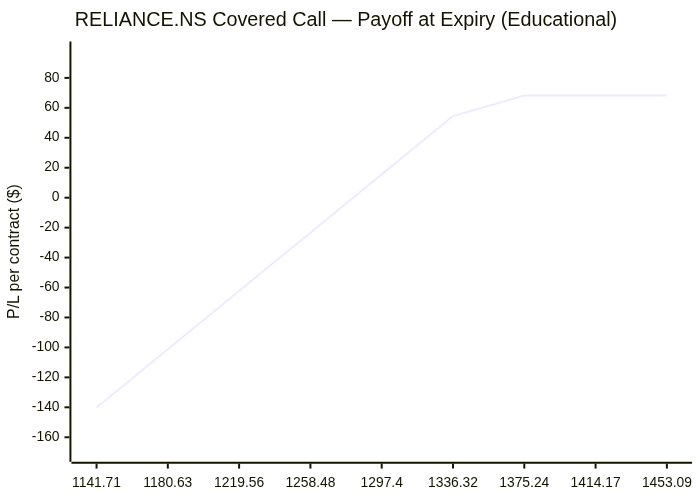
Entry / exit map (Mermaid):

Trading versus investing
Investing focuses on durable ownership, diversification, and compounding. Trading seeks faster tactical returns and carries higher risk. We treat options trading as limited-capital, educational analysis only after core investment capital and emergency liquidity are protected.
PDF report — Premium
Premium members get the full PDF attached to email briefs and can download it here. Upgrade for just $2 a month.
Subscribe for $2/month