
India (NSE) Market Intelligence Brief
Report as-of (US/Eastern): 2026-07-12 23:45:30 EDT
Data sources: NSE pre-open F&O and NSE derivatives quotes
Executive summary
Report as-of (US/Eastern): 2026-07-12 23:45:30 EDT
NSE pre-open F&O data shows mixed sentiment with technology outperforming while financials face pressure. TCS leads gains at +1.36%, while BAJFINANCE (-1.51%) and HDFCBANK (-1.44%) show notable weakness. Banking sector appears under near-term pressure despite positive monthly trends. Options structures favor defensive positioning in financials and selective bullish plays in IT.
*Data sources: NSE pre-open F&O page and NSE official derivatives quote pages*
Index & F&O pre-open regime
No NSE index data retrieved – Unable to assess NIFTY, BANKNIFTY, or MIDCPNIFTY pre-open levels due to data connectivity issues.
Largest movers by %
Large cap
- TCS.NS: ₹2097.1 (+1.36%) – Leading IT services showing strength
- BAJFINANCE.NS: ₹1005.1 (-1.51%) – NBFC under pressure, breaking ₹1000+ psychological level
- HDFCBANK.NS: ₹813.05 (-1.44%) – Banking sector weakness continuing
- SBIN.NS: ₹1026.8 (-0.89%) – State bank showing decline
- BHARTIARTL.NS: ₹1903.4 (-0.89%) – Telecom sector softness
Mid cap
No NSE pre-open movers found due to data retrieval limitations.
Small cap (high risk — proceed with caution)
No NSE pre-open movers found due to data retrieval limitations.
⚠️ Small-cap caution: Small-cap securities carry high risk due to limited liquidity and volatility. Proceed with caution and use limited risk capital only after core investments are secure.
Related news drivers
Technology sector themes dominate with AI-related developments:
- Micron Plans $250B US expansion – Semiconductor capacity expansion
- Apple signs $30B Broadcom deal – AI chip partnerships driving hardware demand
- Intel raises server chip prices as AI demand pushes supply limits
- Credit markets warning on AI stocks – Potential overvaluation concerns
- NVIDIA market cap volatility – Relative price drops amid sector rotation
Corporate developments:
- OpenAI leadership changes – Head of Safety departure
- Apple suing OpenAI for alleged hardware secrets theft
- Microsoft emissions jump 25% – ESG concerns for tech infrastructure
NSE options structure ideas (educational)
Primary bearish structures
BAJFINANCE.NS – Put debit spread targeting ₹980-₹960 range given break below ₹1000 psychological level and weekly weakness (-2.3%)
HDFCBANK.NS – Protective puts or put debit spread around ₹800-790 support, capitalizing on -2.02% weekly decline
SBIN.NS – Put debit spread targeting ₹1000-980 range given banking sector pressure and -1.05% weekly trend
BHARTIARTL.NS – Put debit spread (₹1900/₹1850) on telecom weakness despite monthly uptrend
Primary bullish structure
TCS.NS – Call debit spread targeting 2100-2150 range, capitalizing on +1.92% weekly momentum and IT sector strength
Structure limitations
Critical note: NSE options chain data unavailable due to connection timeouts. All strike recommendations require verification through NSE derivatives platform for current liquidity, bid/ask spreads, and available expiries.
Risks & watch-outs
Data integrity risks:
- NSE index data unavailable – cannot assess broader market regime
- Options chain data timeouts limit precise structure validation
- Verify all strikes and liquidity before execution
Market structure risks:
- Small-cap liquidity risk: Limited small-cap data available; these securities carry high gap risk and should only be traded with limited capital after securing core investments
- Banking sector headwinds: Multiple large financials showing weakness despite positive monthly trends
- Currency exposure: Non-INR traders face additional FX risk on all NSE positions
Sector-specific risks:
- AI stock valuations: Credit markets signaling potential overvaluation in technology
- Regulatory changes: Banking and telecom sectors sensitive to policy shifts
- Gap risk: Pre-open data may not reflect actual opening prices due to overnight developments
Options-specific risks:
- Unable to assess current implied volatility levels
- Time decay impact unknown without chain data
- Liquidity verification required for all suggested structures
*This analysis is educational only and not personalized financial advice. Verify all data through official NSE sources before trading.*
Visual strategy maps
Payoff curves and entry/exit zones below are educational aids — not trade instructions. Confirm with your own chart, liquidity, and risk limits.
BAJFINANCE.NS: Bear Put Spread
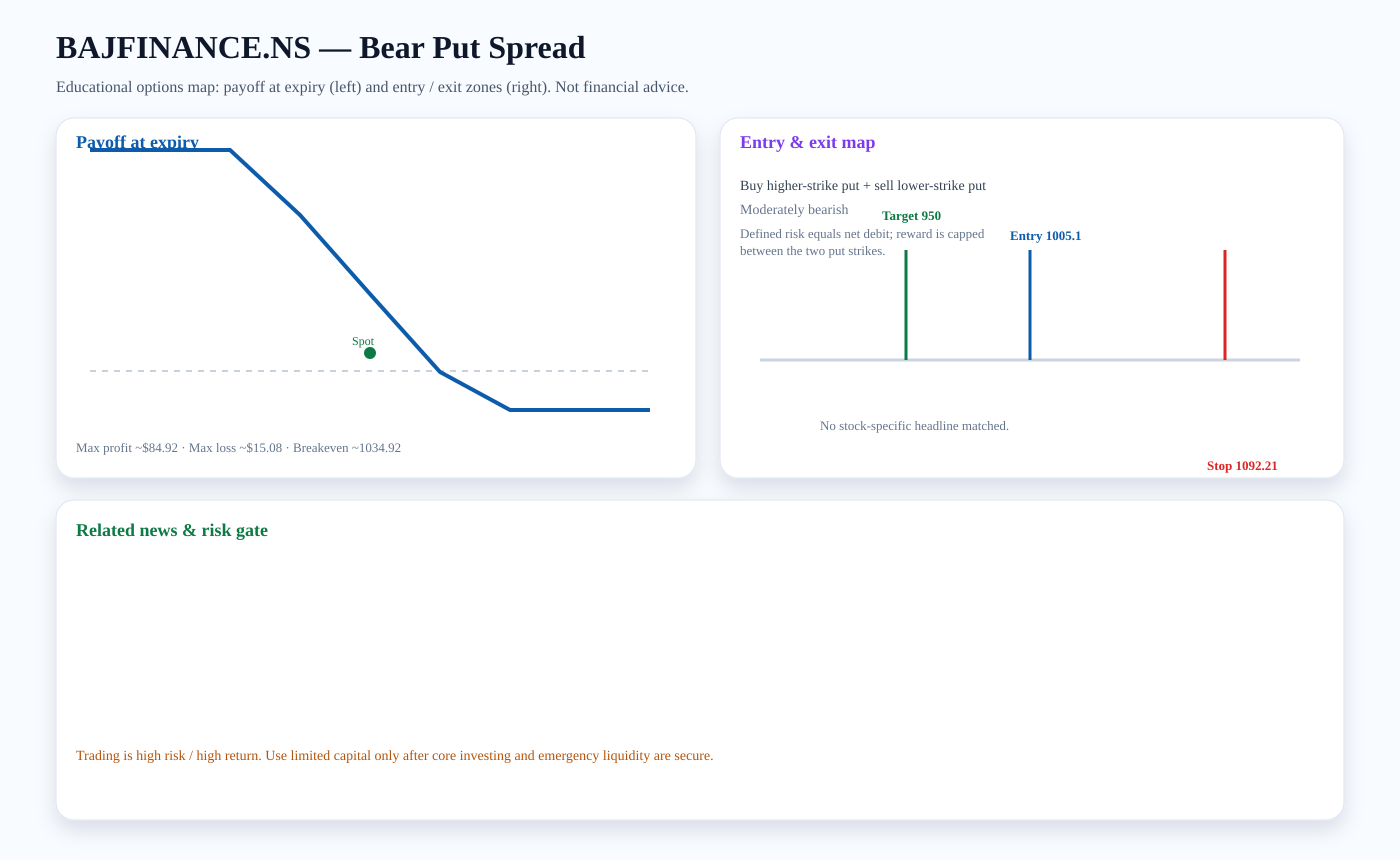
Structure: Buy higher-strike put + sell lower-strike put
Outlook: Moderately bearish
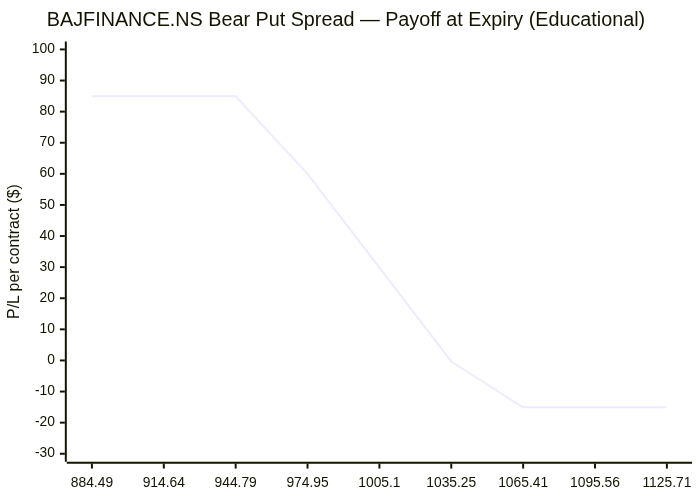
Entry zone: ~1005.1 · Target: ~950 · Stop: ~1092.21 · Breakeven: ~1034.92
Risk note: Defined risk equals net debit; reward is capped between the two put strikes.
Payoff chart (Mermaid):
Entry / exit map (Mermaid):

HDFCBANK.NS: Bear Put Spread
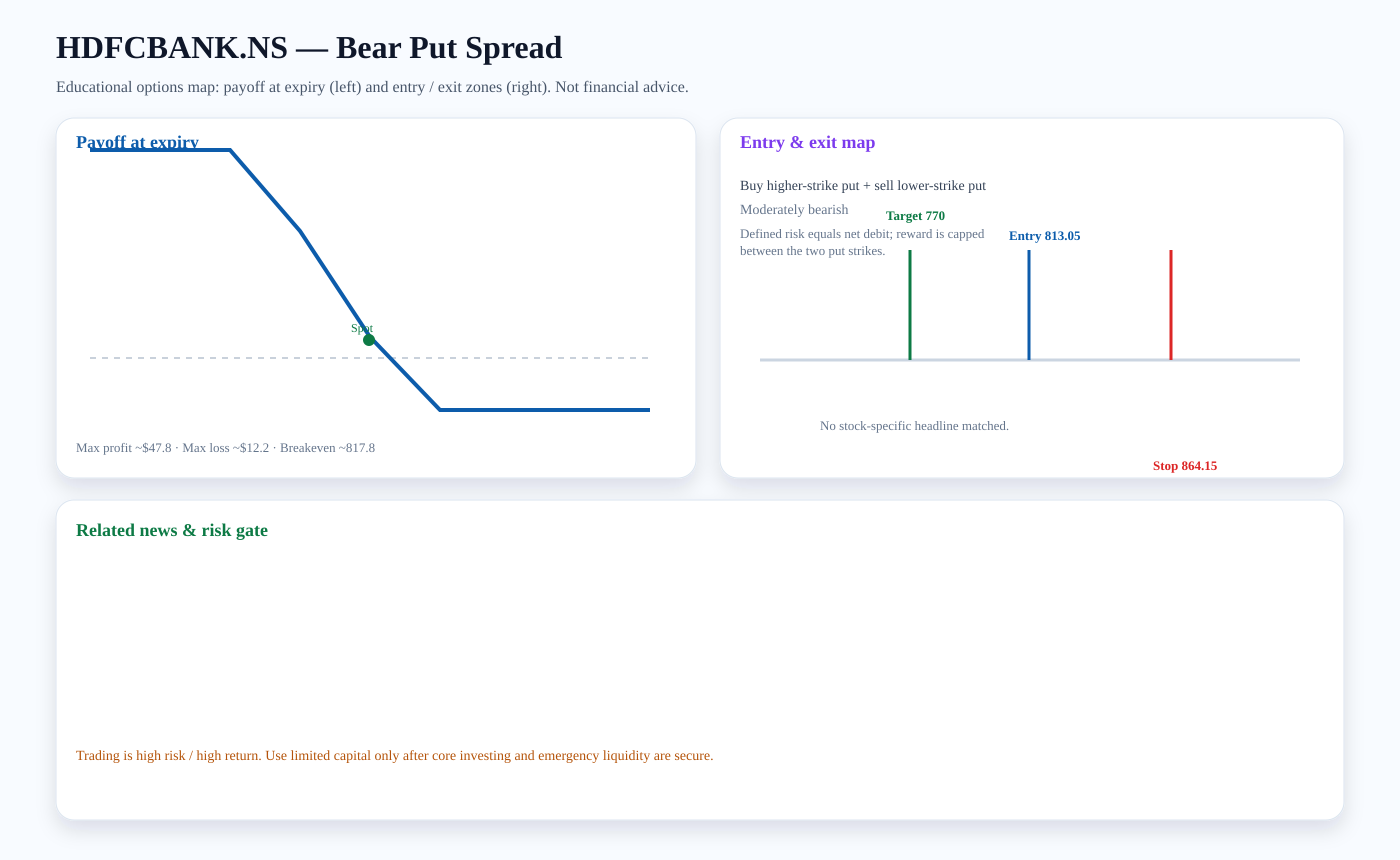
Structure: Buy higher-strike put + sell lower-strike put
Outlook: Moderately bearish
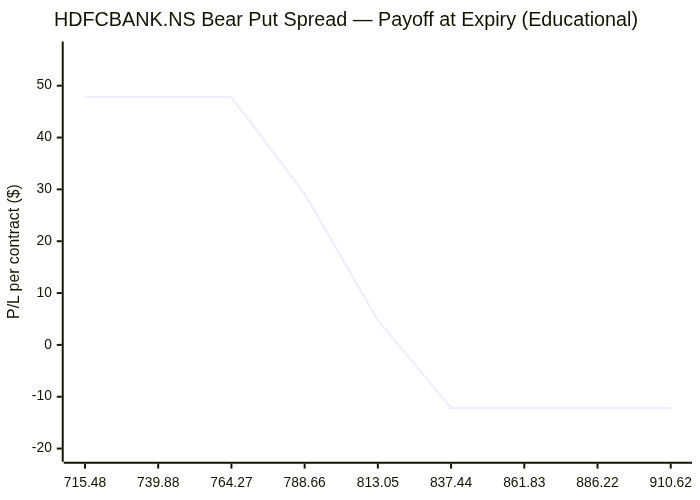
Entry zone: ~813.05 · Target: ~770 · Stop: ~864.15 · Breakeven: ~817.8
Risk note: Defined risk equals net debit; reward is capped between the two put strikes.
Payoff chart (Mermaid):
Entry / exit map (Mermaid):

TCS.NS: Bull Call Spread
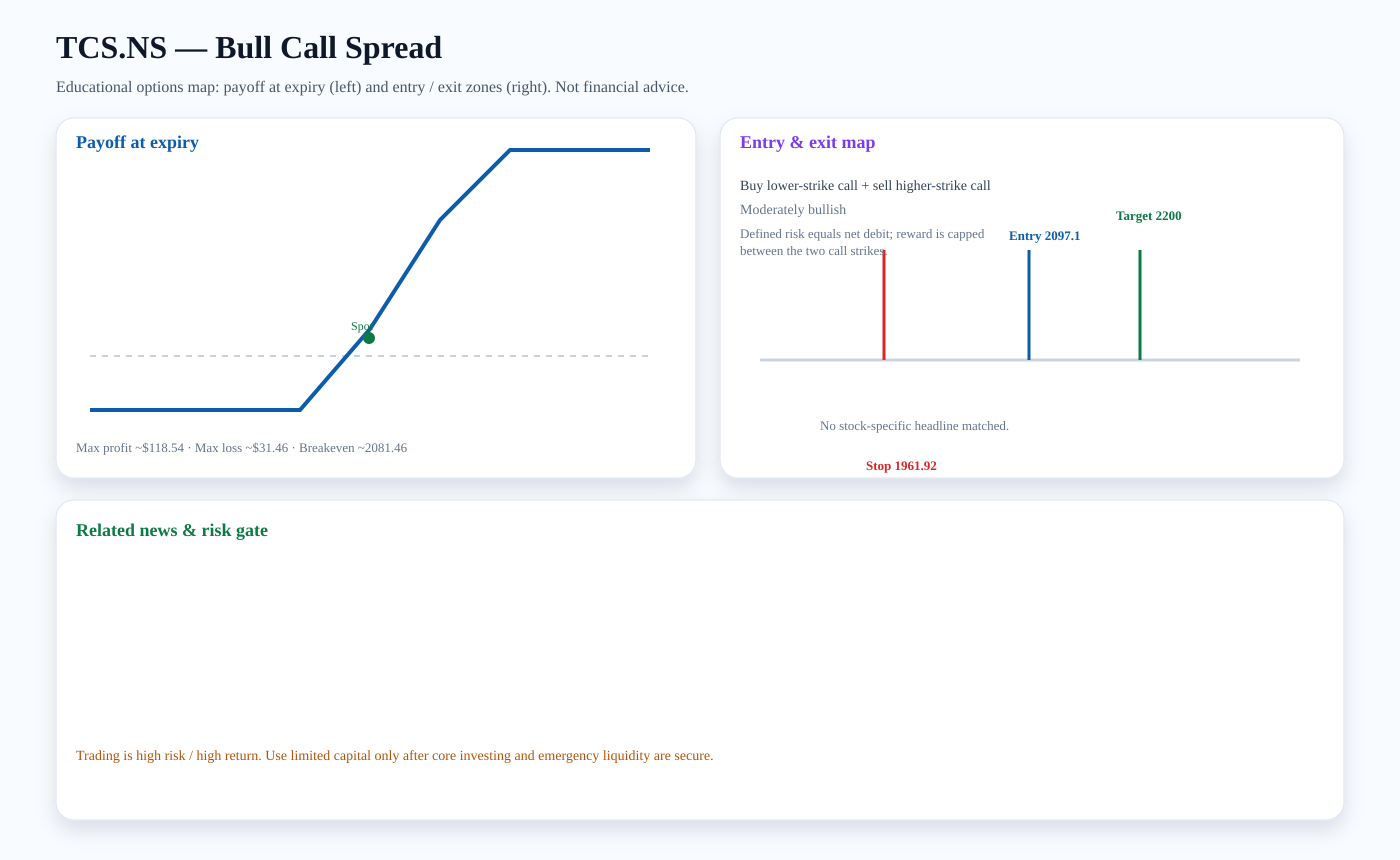
Structure: Buy lower-strike call + sell higher-strike call
Outlook: Moderately bullish
Entry zone: ~2097.1 · Target: ~2200 · Stop: ~1961.92 · Breakeven: ~2081.46
Risk note: Defined risk equals net debit; reward is capped between the two call strikes.
Payoff chart (Mermaid):
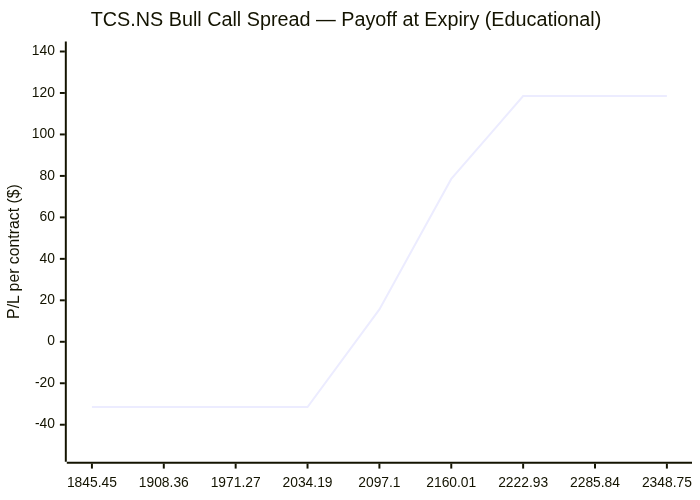
Entry / exit map (Mermaid):

SBIN.NS: Bear Put Spread
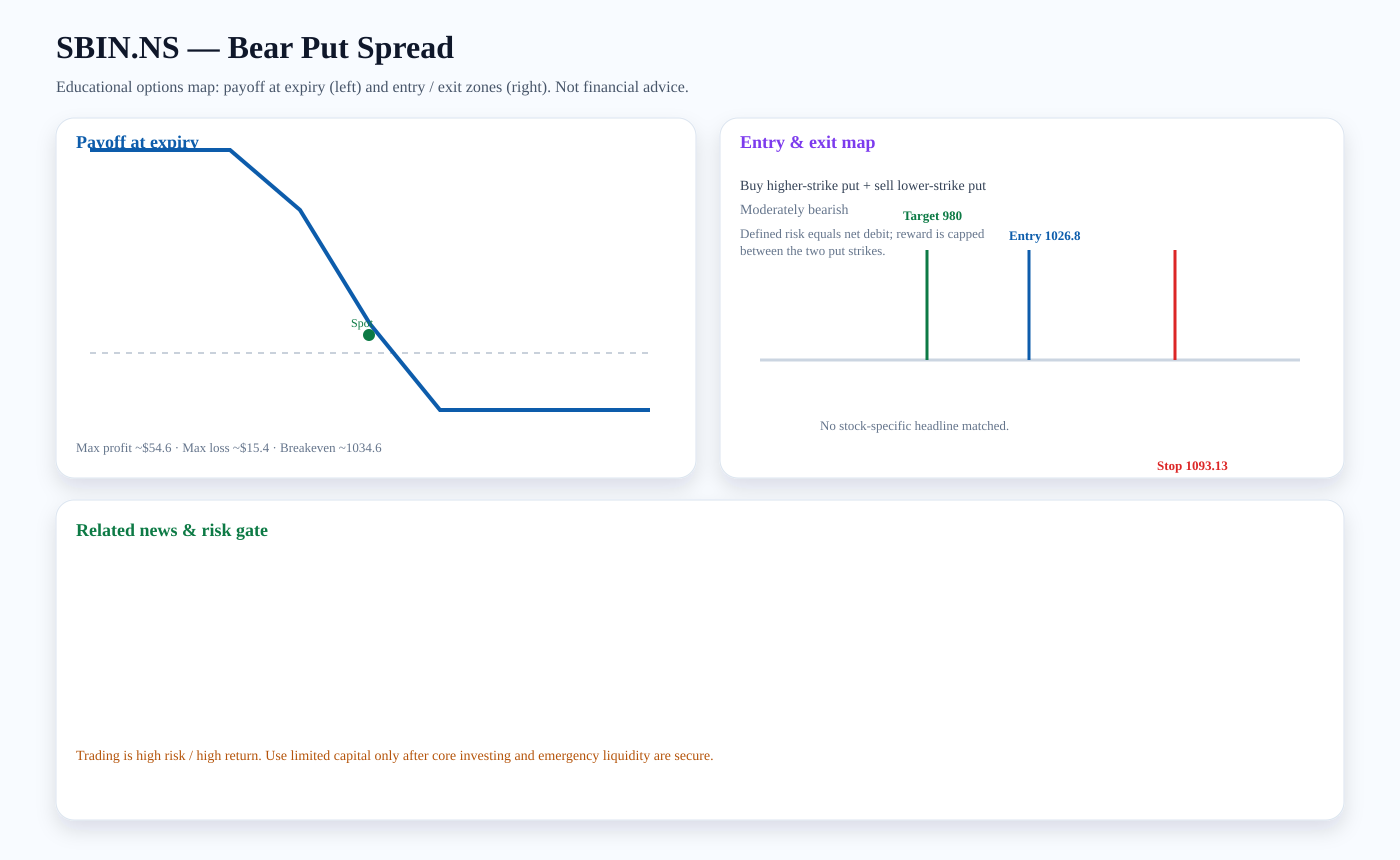
Structure: Buy higher-strike put + sell lower-strike put
Outlook: Moderately bearish
Entry zone: ~1026.8 · Target: ~980 · Stop: ~1093.13 · Breakeven: ~1034.6
Risk note: Defined risk equals net debit; reward is capped between the two put strikes.
Payoff chart (Mermaid):
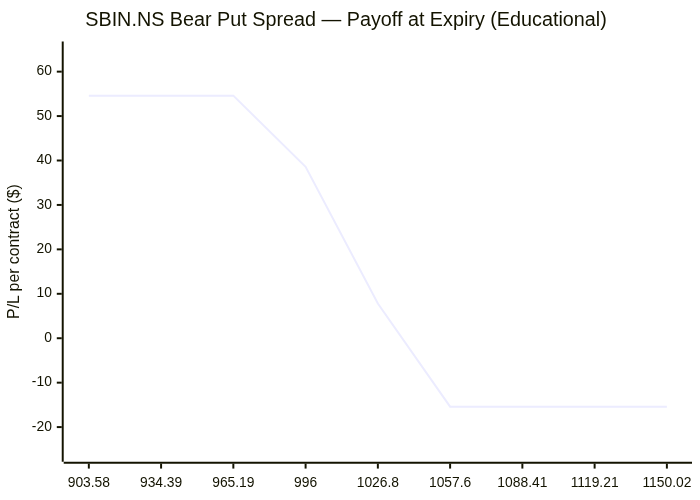
Entry / exit map (Mermaid):

Trading versus investing
Investing focuses on durable ownership, diversification, and compounding. Trading seeks faster tactical returns and carries higher risk. We treat options trading as limited-capital, educational analysis only after core investment capital and emergency liquidity are protected.
PDF report — Premium
Premium members get the full PDF attached to email briefs and can download it here. Upgrade for just $2 a month.
Subscribe for $2/month