
India (NSE) Market Intelligence Brief
Report as-of (US/Eastern): 2026-07-13 23:18:41 EDT
Data sources: NSE pre-open F&O and NSE derivatives quotes
Executive summary
Report as-of (US/Eastern): 2026-07-13 23:18:41 EDT
NSE pre-open F&O data shows mixed sentiment with IT stocks leading gains while telecom and FMCG names decline. TCS emerges as the standout performer (+5.44%) driven by a multi-million ABB AI deal and strong Q1 earnings. The session reflects selective strength in quality IT names amid broader AI disruption concerns affecting the sector. Limited index data availability constrains broader market assessment.
*Data sources: NSE pre-open F&O page and NSE official derivatives quote pages*
Index & F&O pre-open regime
No NSE index data retrieved – Unable to assess NIFTY, BANKNIFTY, MIDCPNIFTY, or other derivative index trends due to data connectivity issues. This limits broader market context for individual stock movements.
Largest movers by percentage
Large cap
- TCS.NS: ₹2181.5 (+5.44%) – Strong rally on ABB AI deal and Q1 earnings beat
- INFY.NS: ₹1102.6 (+3.24%) – Following IT sector momentum despite AI disruption concerns
- KOTAKBANK.NS: ₹384.65 (+1.87%) – Supported by bonus share declaration
- BHARTIARTL.NS: ₹1901.8 (-0.97%) – Declining amid weekly weakness
- HINDUNILVR.NS: ₹2130.6 (-0.93%) – Continuing recent downtrend
Mid cap
No NSE pre-open movers found in mid-cap segment.
Small cap (high risk — proceed with caution)
No NSE pre-open movers found in small-cap segment.
Risk Warning: Small-cap investments carry significant liquidity and volatility risks. Investors should proceed with extreme caution and allocate only limited risk capital after securing core portfolio investments.
Related news drivers
IT Sector Focus: Multiple headlines highlight AI disruption concerns affecting Indian IT firms, with TCS bucking the trend through a major ABB AI partnership deal. The sector faces "muted Q1 as AI shift and weak demand weigh" according to recent reports.
TCS Specific: Company shares rallied 6-8% over two sessions following announcement of multi-million dollar ABB AI deal and better-than-expected Q1 earnings, suggesting quality differentiation within the sector.
Broader Tech: International headlines emphasize semiconductor and AI chip momentum, potentially providing sector tailwinds for Indian IT services companies positioned in AI implementation.
NSE options structure ideas (educational)
Primary Bullish Plays
TCS.NS – Call debit spreads targeting ₹2250-2300 resistance levels, capitalizing on earnings momentum and AI deal catalyst. Weekly trend +6.02% supports continued upside.
INFY.NS – Call structures around ₹1100-1150 strikes to capture momentum from +5.8% weekly gains, despite monthly weakness.
Primary Bearish Plays
BHARTIARTL.NS – Put debit spreads targeting ₹1850-1870 support, given -1.24% weekly decline overriding monthly strength.
HINDUNILVR.NS – Protective puts or put spreads around ₹2100-2080 levels, following -3.24% weekly downtrend.
Neutral Income Strategies
KOTAKBANK.NS – Covered calls at ₹395-400 strikes for bonus-related volatility, or cash-secured puts at ₹375-380 support.
Note: NSE options chain data unavailable due to connection timeout – verify bid/ask spreads and liquidity before execution.
Risks & watch-outs
Data Limitations: NSE index and detailed options chain data unavailable, limiting comprehensive market assessment and precise strike selection.
Sector Rotation Risk: AI disruption concerns could reverse IT sector gains rapidly, while selective strength may not sustain across all names.
Liquidity Concerns: Unable to assess options bid/ask spreads due to data connectivity issues. Verify liquidity directly on NSE platform before execution.
Gap Risk: Pre-open moves may not sustain through regular trading hours, particularly for earnings-driven rallies like TCS.
Small-Cap Warning: No small-cap movers identified, but investors should exercise extreme caution with any small-cap F&O positions due to liquidity constraints and gap risk potential.
Currency & Macro: INR volatility and broader market moves could override individual stock technicals, especially given limited index visibility.
Visual strategy maps
Payoff curves and entry/exit zones below are educational aids — not trade instructions. Confirm with your own chart, liquidity, and risk limits.
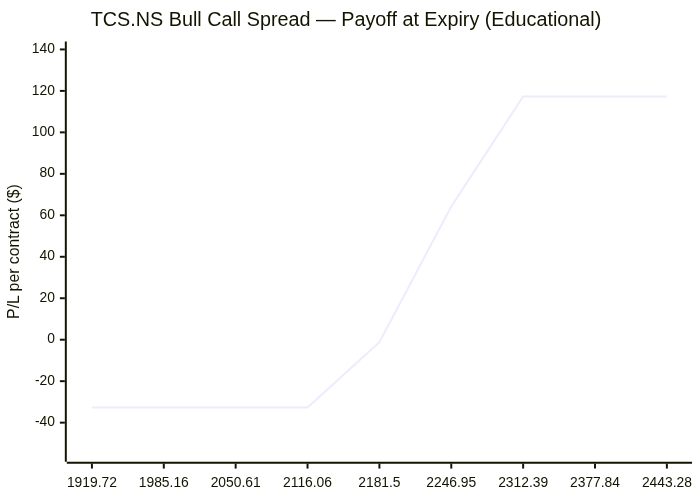
TCS.NS: Bull Call Spread
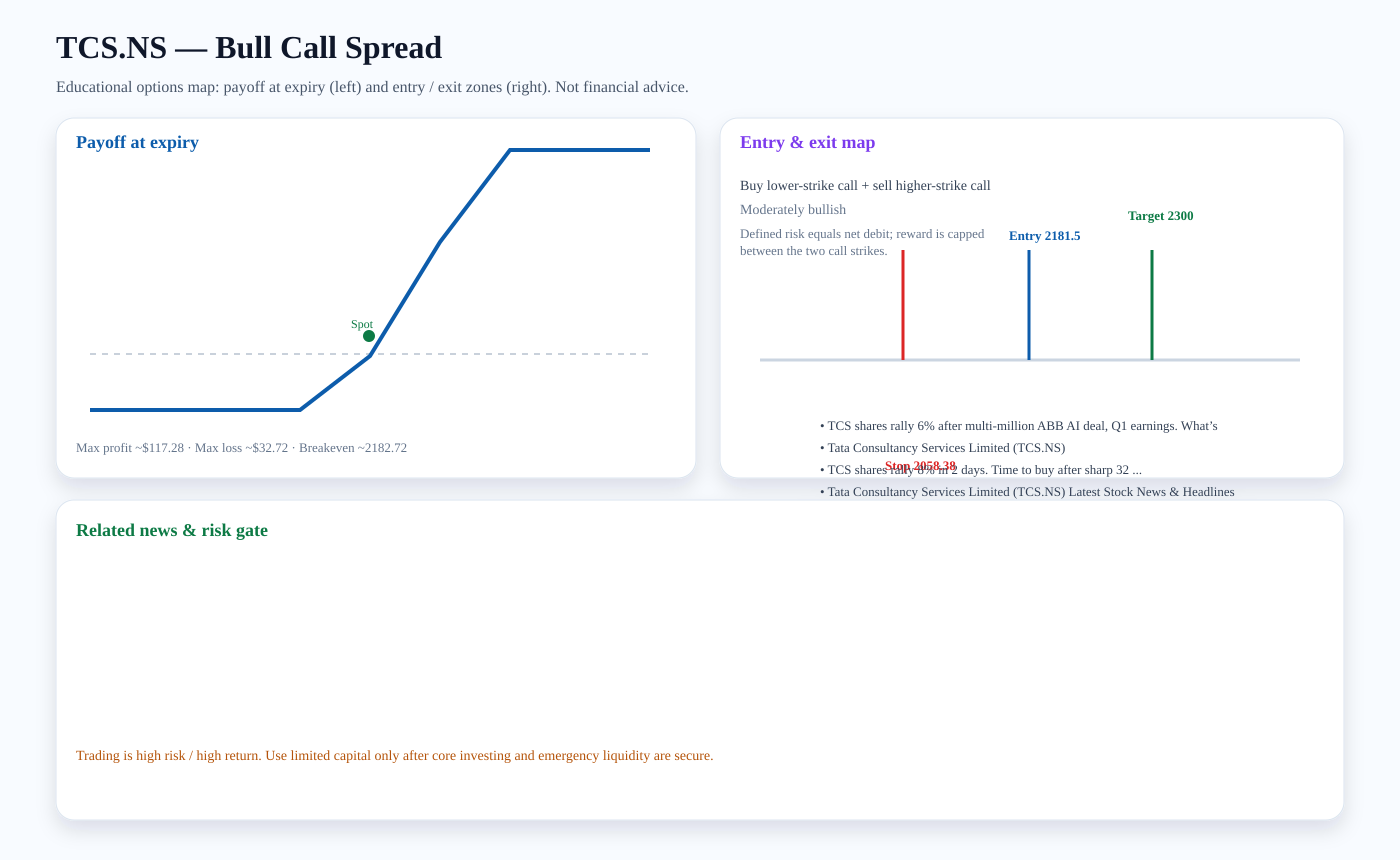
Structure: Buy lower-strike call + sell higher-strike call
Outlook: Moderately bullish
Entry zone: ~2181.5 · Target: ~2300 · Stop: ~2058.38 · Breakeven: ~2182.72
Risk note: Defined risk equals net debit; reward is capped between the two call strikes.
Related news links:
Payoff chart (Mermaid):
Entry / exit map (Mermaid):

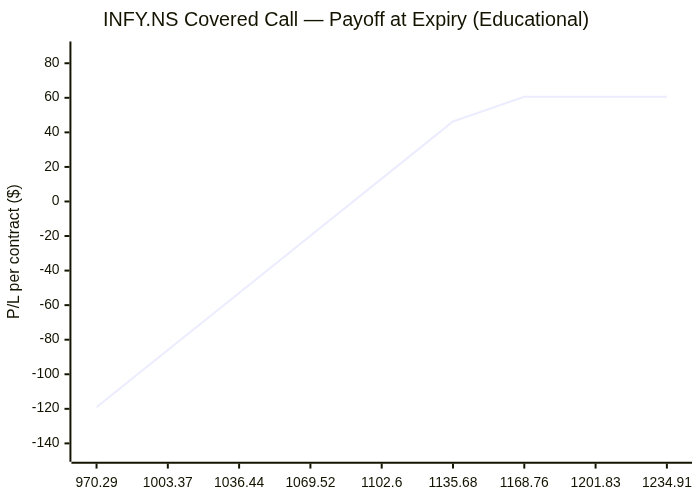
INFY.NS: Covered Call
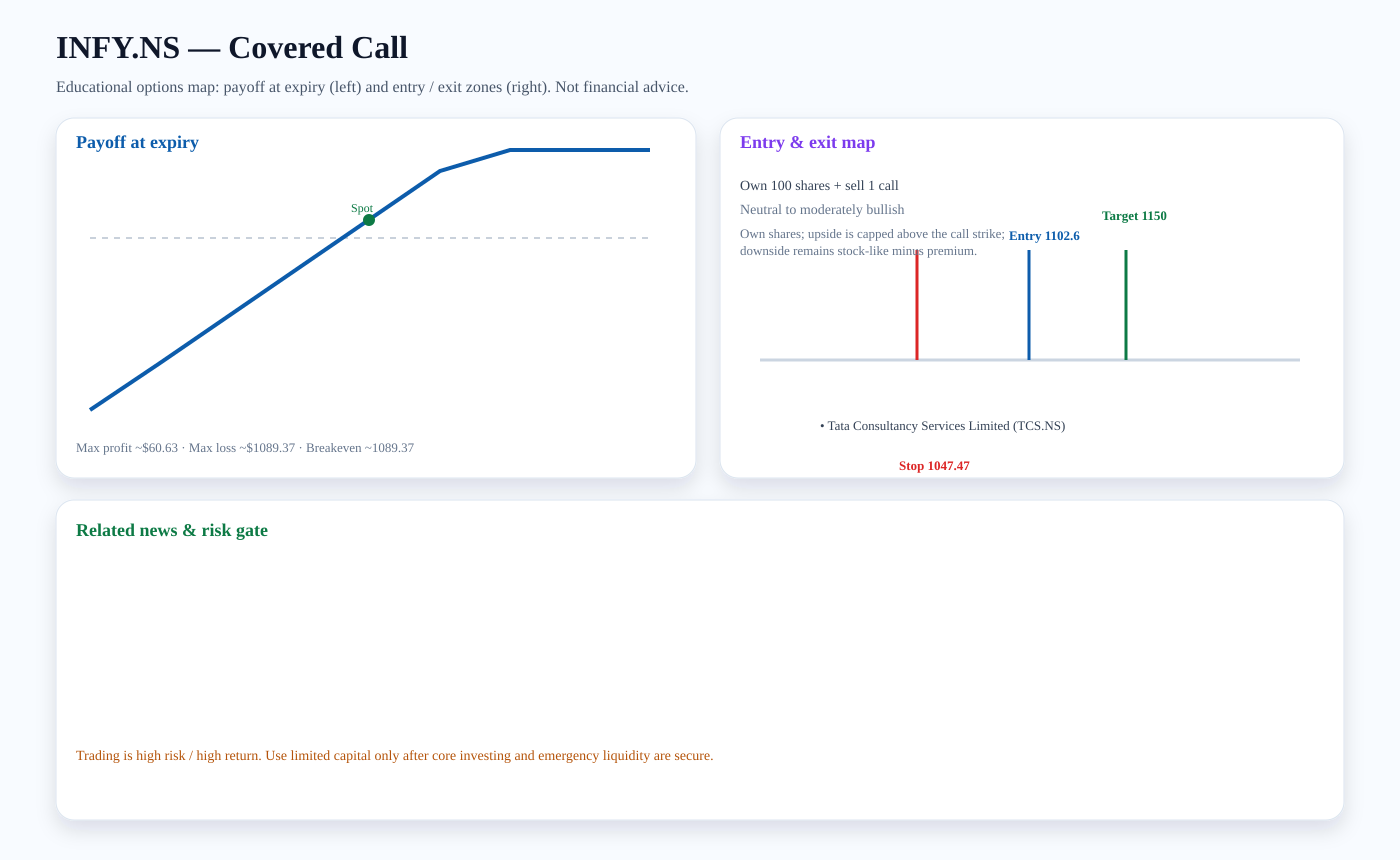
Structure: Own 100 shares + sell 1 call
Outlook: Neutral to moderately bullish
Entry zone: ~1102.6 · Target: ~1150 · Stop: ~1047.47 · Breakeven: ~1089.37
Risk note: Own shares; upside is capped above the call strike; downside remains stock-like minus premium.
Related news links:
Payoff chart (Mermaid):
Entry / exit map (Mermaid):

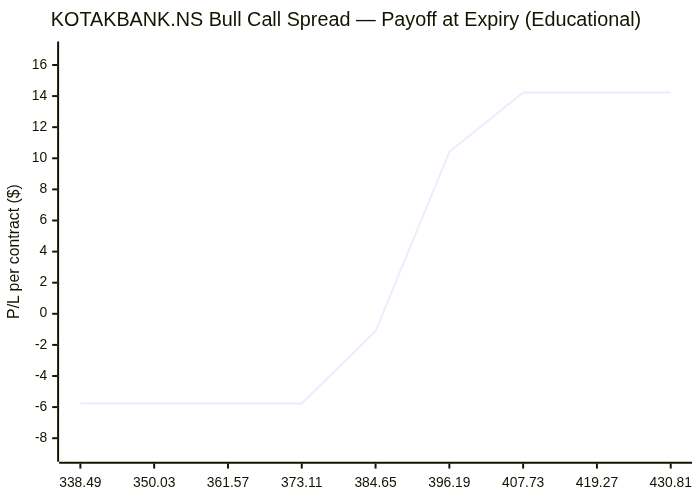
KOTAKBANK.NS: Bull Call Spread
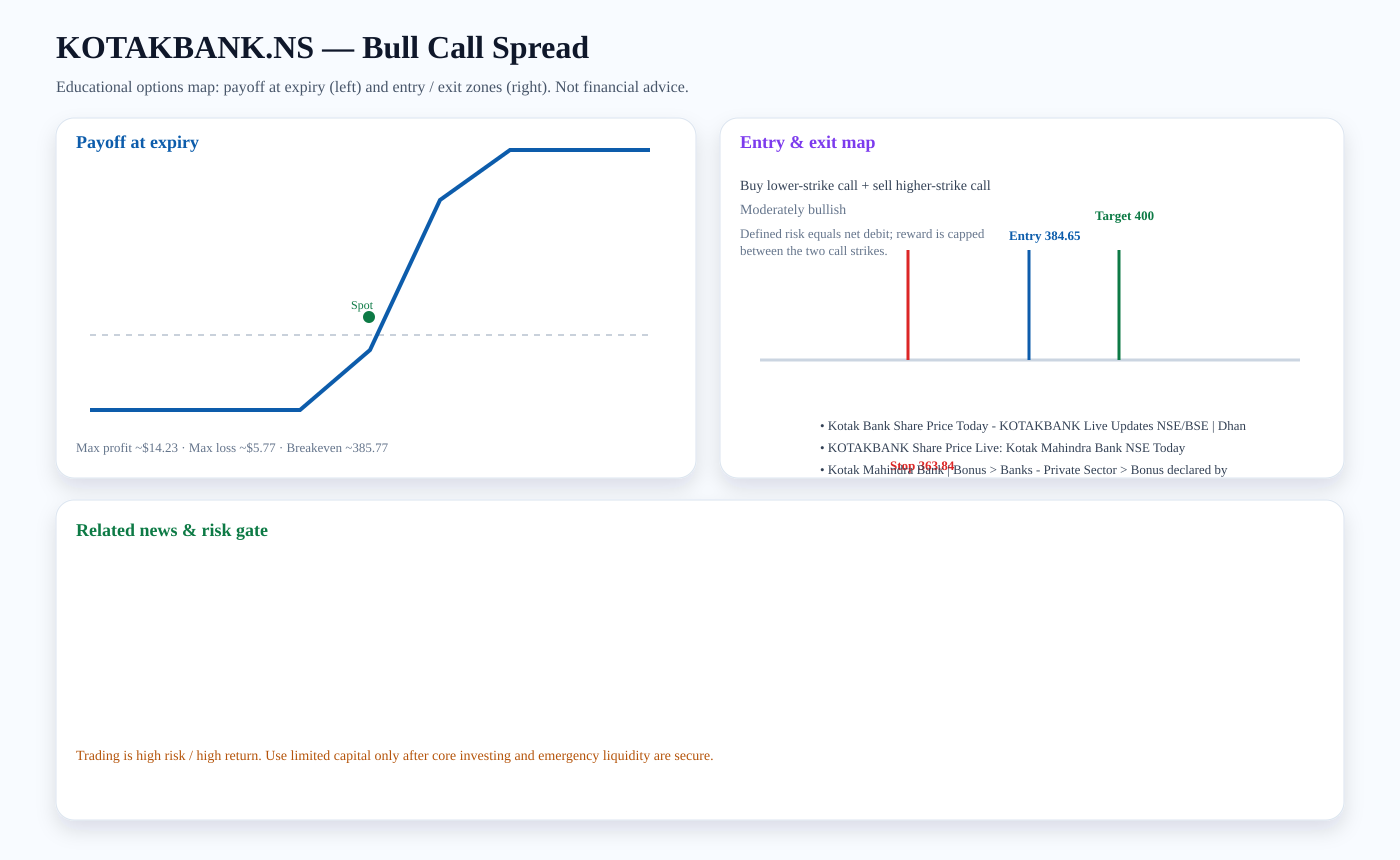
Structure: Buy lower-strike call + sell higher-strike call
Outlook: Moderately bullish
Entry zone: ~384.65 · Target: ~400 · Stop: ~363.84 · Breakeven: ~385.77
Risk note: Defined risk equals net debit; reward is capped between the two call strikes.
Related news links:
Payoff chart (Mermaid):
Entry / exit map (Mermaid):

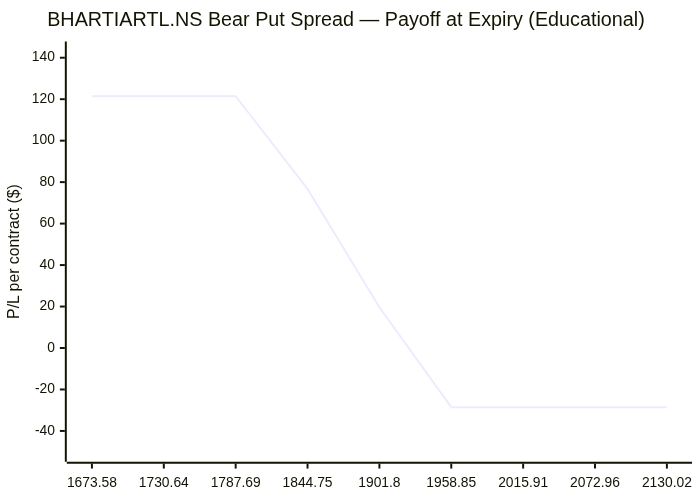
BHARTIARTL.NS: Bear Put Spread
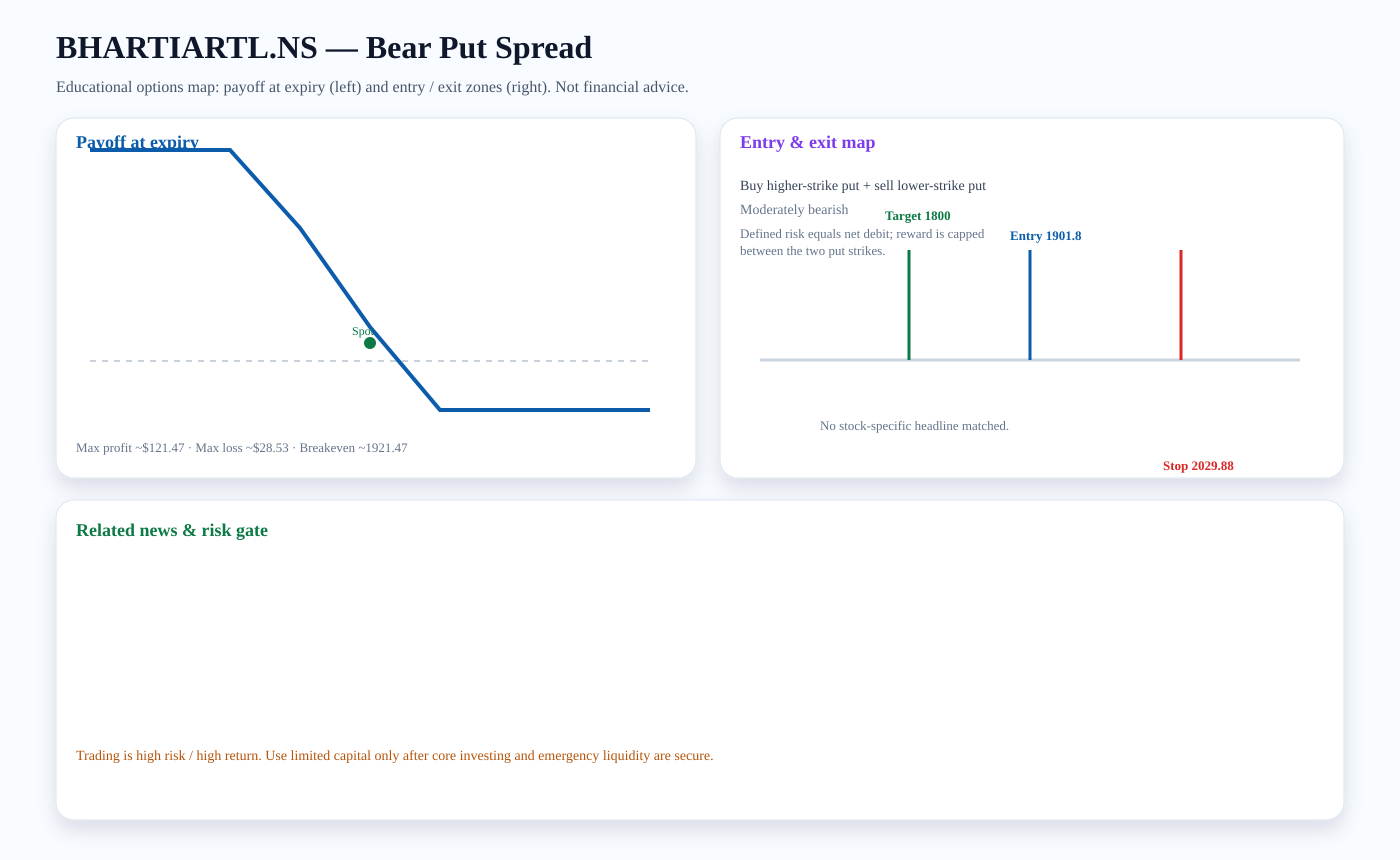
Structure: Buy higher-strike put + sell lower-strike put
Outlook: Moderately bearish
Entry zone: ~1901.8 · Target: ~1800 · Stop: ~2029.88 · Breakeven: ~1921.47
Risk note: Defined risk equals net debit; reward is capped between the two put strikes.
Payoff chart (Mermaid):
Entry / exit map (Mermaid):

Trading versus investing
Investing focuses on durable ownership, diversification, and compounding. Trading seeks faster tactical returns and carries higher risk. We treat options trading as limited-capital, educational analysis only after core investment capital and emergency liquidity are protected.
PDF report — Premium
Premium members get the full PDF attached to email briefs and can download it here. Upgrade for just $2 a month.
Subscribe for $2/month