
India (NSE) Market Intelligence Brief
Report as-of (US/Eastern): 2026-07-14 23:18:08 EDT
Data sources: NSE pre-open F&O and NSE derivatives quotes
Executive summary
Report as-of (US/Eastern): 2026-07-14 23:18:08 EDT
NSE pre-open F&O data shows mixed sentiment with banking heavyweights under pressure while telecom shows strength. BHARTIARTL leads gains at +1.82%, while major banks including SBIN (-2.08%), BAJFINANCE (-1.56%), KOTAKBANK (-1.56%), and HDFCBANK (-1.05%) face selling pressure. Banking sector weakness dominates the pre-open session, suggesting potential sector rotation or earnings concerns.
Data sources: NSE pre-open F&O page and NSE official derivatives quote pages.
Index & F&O pre-open regime
No NSE index data retrieved – Official NIFTY, BANKNIFTY, and MIDCPNIFTY pre-open levels unavailable due to data connection issues. This limits broader market context assessment for the session.
Largest movers by percentage
Large cap
- BHARTIARTL.NS: ₹1936.5 (+1.82%) – Leading telecom showing strength
- HDFCBANK.NS: ₹809.4 (-1.05%) – Banking pressure continues
- BAJFINANCE.NS: ₹1006.6 (-1.56%) – NBFC under selling pressure
- KOTAKBANK.NS: ₹378.65 (-1.56%) – Private bank weakness
- SBIN.NS: ₹1015.4 (-2.08%) – PSU bank leading declines
Mid cap
No NSE pre-open movers found – Mid-cap data unavailable in current dataset.
Small cap (high risk — proceed with caution)
No NSE pre-open movers found – Small-cap data unavailable.
⚠️ Small-cap caution: Small-cap stocks carry high liquidity risk and extreme volatility. Use limited risk capital only after securing core portfolio investments.
Related news drivers
Limited India-specific headlines available. Key themes from related coverage:
- Technology/AI focus: Multiple headlines reference chip stocks and AI infrastructure development
- Banking sector: HDFC Bank mentioned in options-related coverage
- Global context: US-Iran conflict and semiconductor sector developments may influence Indian tech and banking sentiment
NSE options structure ideas (educational)
Primary bearish plays
SBIN.NS – Put debit spread targeting ₹1000-980 range on banking sector weakness and -2.08% session decline.
BAJFINANCE.NS – Put structures favored given -1.56% decline and -3.44% weekly weakness despite monthly gains.
Primary bullish play
BHARTIARTL.NS – Call debit spread capitalizing on +1.82% strength and +5.18% monthly momentum in telecom sector.
Mixed/defensive structures
HDFCBANK.NS and KOTAKBANK.NS – Put spreads or protective puts given near-term weakness, though monthly trends remain mixed.
Note: NSE options chain data unavailable due to connection timeouts – verify bid/ask spreads and liquidity before execution.
Risks & watch-outs
Market structure risks
- Data limitations: NSE index and detailed options chain data unavailable, limiting precision
- Banking sector concentration: Four of five top movers are financial stocks, indicating sector-specific pressure
- Time zone mismatch: US Eastern time reporting on NSE pre-open may create execution timing challenges
Trading risks
- Options liquidity: Cannot verify current bid/ask spreads due to NSE connection issues
- Gap risk: Pre-open levels may gap significantly from previous close
- Currency exposure: INR volatility affects non-domestic traders
- Small-cap liquidity: Extremely limited liquidity and high volatility – use minimal risk capital only after core investments secured
Sector watch-outs
- Banking regulatory changes or policy announcements
- Telecom sector momentum sustainability
- Broader market sentiment shifts affecting large-cap rotation
Visual strategy maps
Payoff curves and entry/exit zones below are educational aids — not trade instructions. Confirm with your own chart, liquidity, and risk limits.
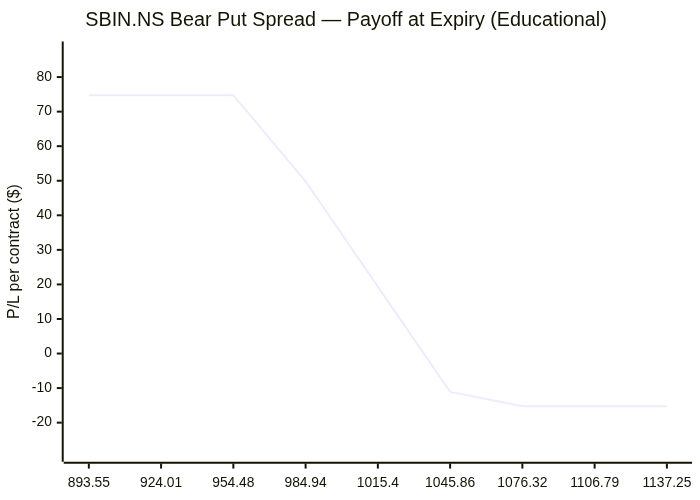
SBIN.NS: Bear Put Spread
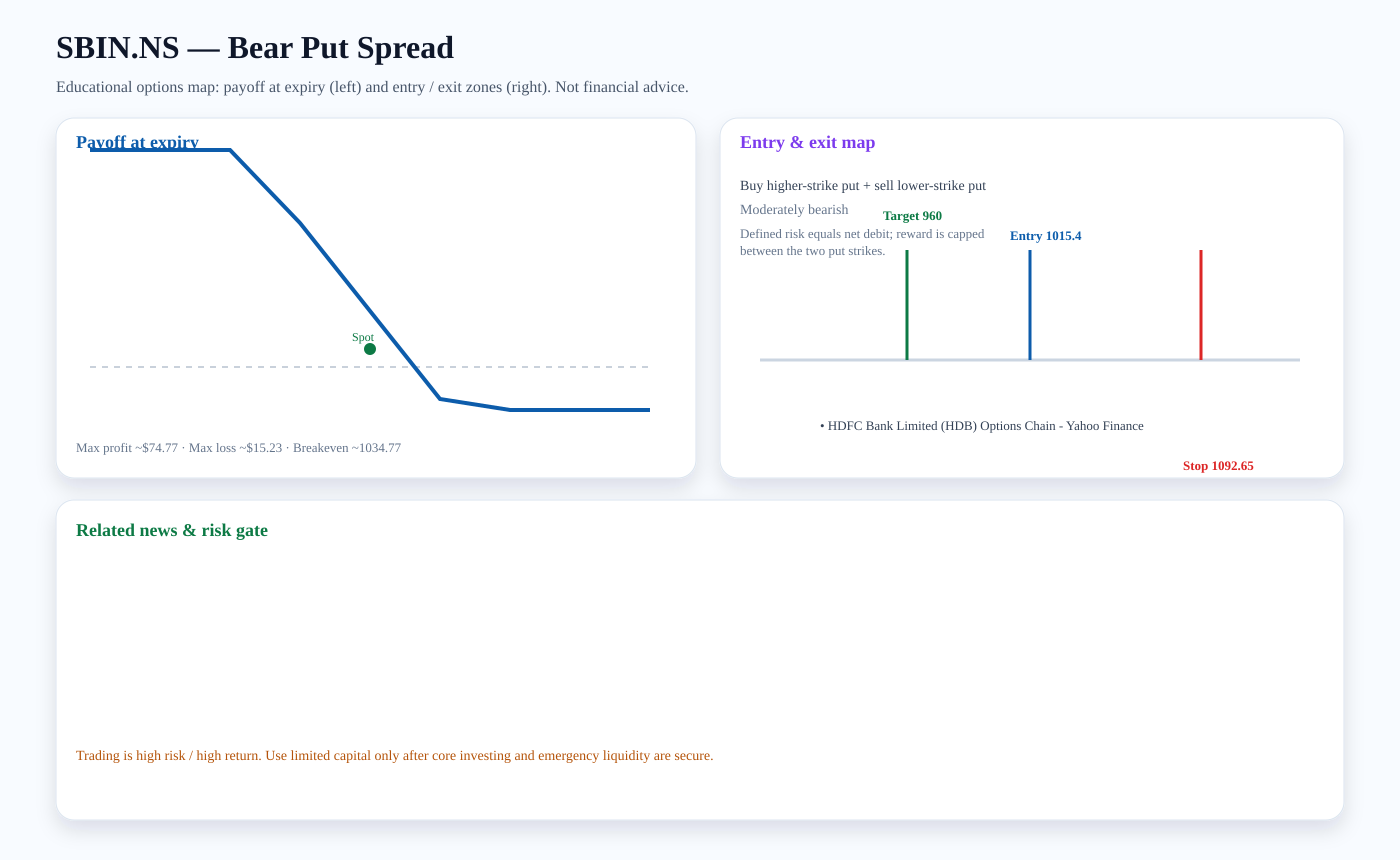
Structure: Buy higher-strike put + sell lower-strike put
Outlook: Moderately bearish
Entry zone: ~1015.4 · Target: ~960 · Stop: ~1092.65 · Breakeven: ~1034.77
Risk note: Defined risk equals net debit; reward is capped between the two put strikes.
Related news links:
Payoff chart (Mermaid):
Entry / exit map (Mermaid):

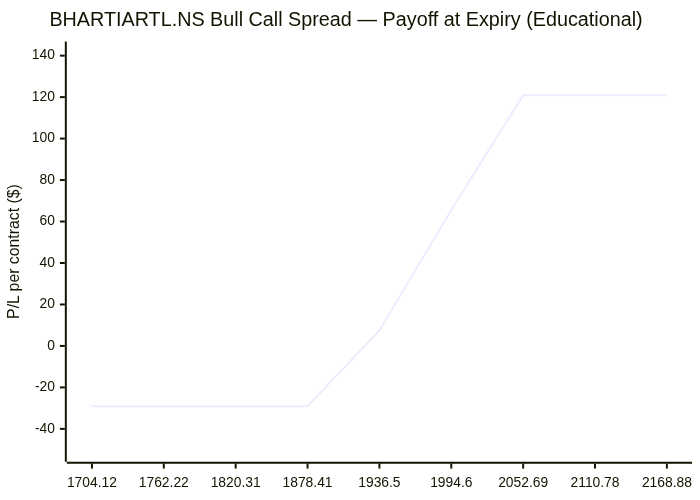
BHARTIARTL.NS: Bull Call Spread
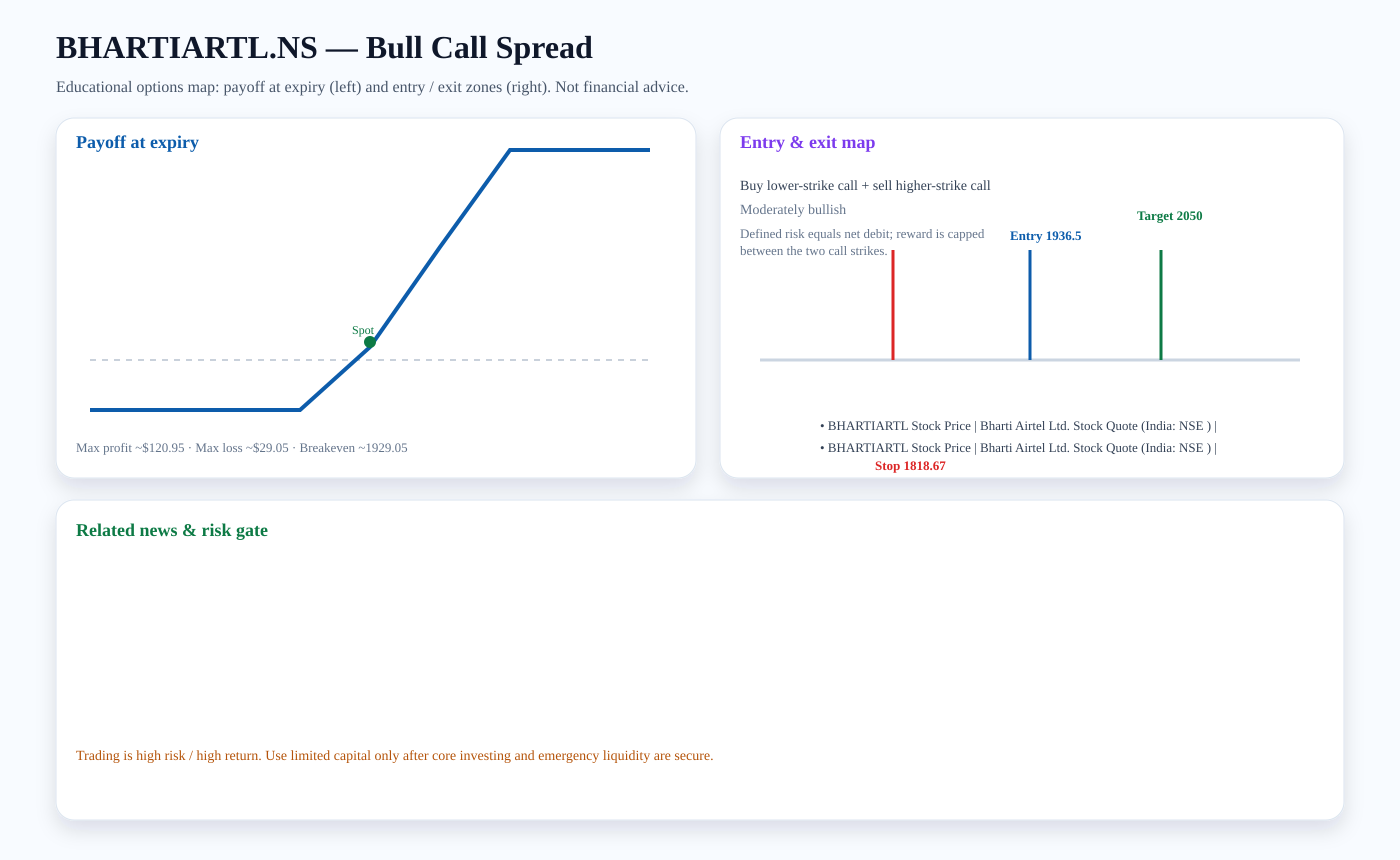
Structure: Buy lower-strike call + sell higher-strike call
Outlook: Moderately bullish
Entry zone: ~1936.5 · Target: ~2050 · Stop: ~1818.67 · Breakeven: ~1929.05
Risk note: Defined risk equals net debit; reward is capped between the two call strikes.
Related news links:
Payoff chart (Mermaid):
Entry / exit map (Mermaid):

BAJFINANCE.NS: Bear Put Spread
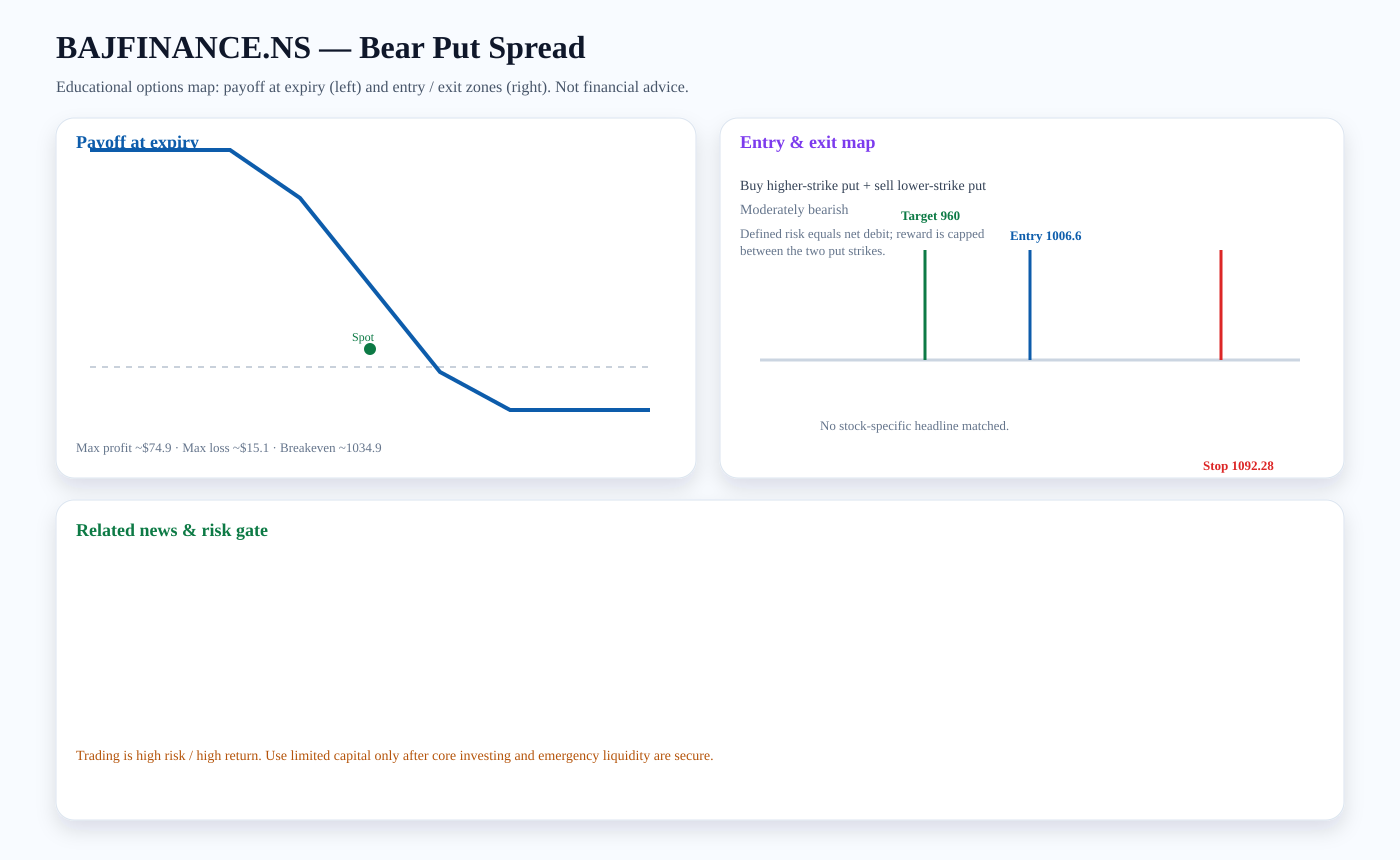
Structure: Buy higher-strike put + sell lower-strike put
Outlook: Moderately bearish
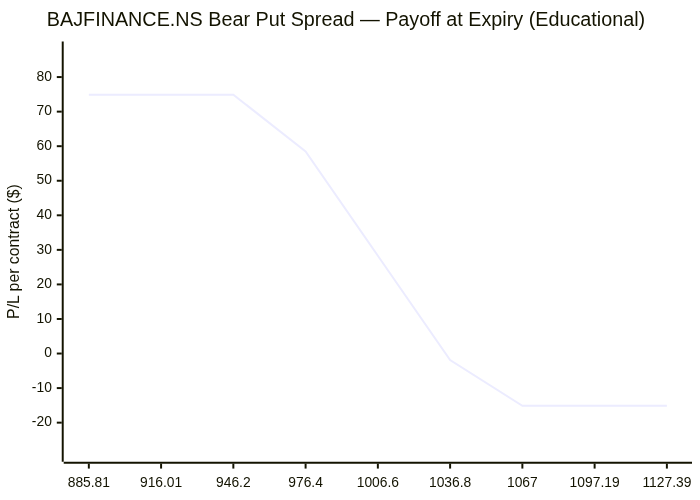
Entry zone: ~1006.6 · Target: ~960 · Stop: ~1092.28 · Breakeven: ~1034.9
Risk note: Defined risk equals net debit; reward is capped between the two put strikes.
Payoff chart (Mermaid):
Entry / exit map (Mermaid):

KOTAKBANK.NS: Bear Put Spread
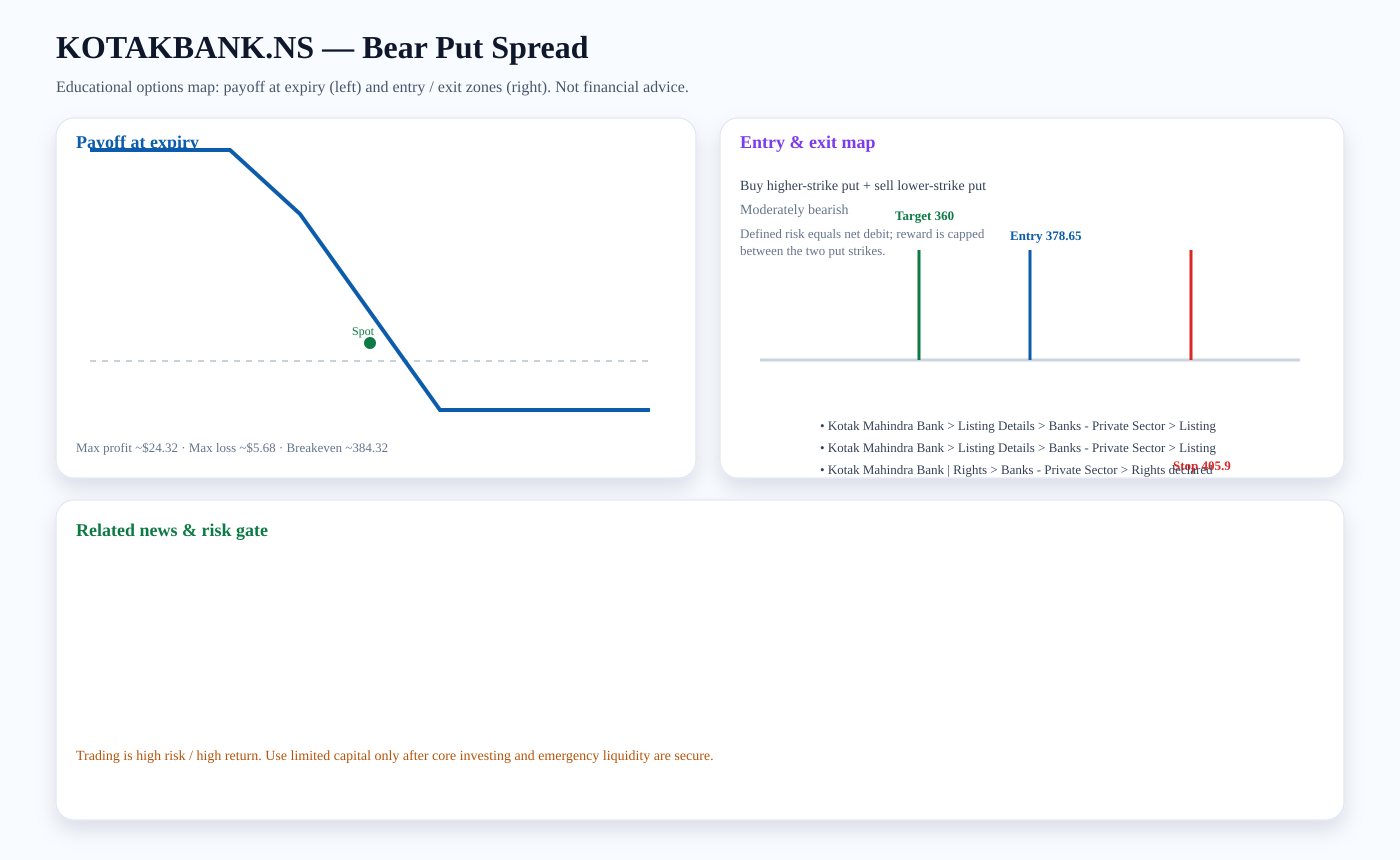
Structure: Buy higher-strike put + sell lower-strike put
Outlook: Moderately bearish
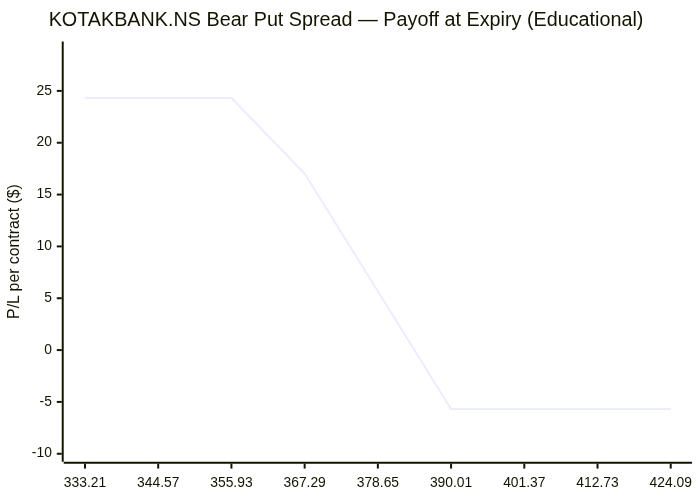
Entry zone: ~378.65 · Target: ~360 · Stop: ~405.9 · Breakeven: ~384.32
Risk note: Defined risk equals net debit; reward is capped between the two put strikes.
Related news links:
Payoff chart (Mermaid):
Entry / exit map (Mermaid):

Trading versus investing
Investing focuses on durable ownership, diversification, and compounding. Trading seeks faster tactical returns and carries higher risk. We treat options trading as limited-capital, educational analysis only after core investment capital and emergency liquidity are protected.
PDF report — Premium
Premium members get the full PDF attached to email briefs and can download it here. Upgrade for just $2 a month.
Subscribe for $2/month