
India (NSE) Market Intelligence Brief
Report as-of (US/Eastern): 2026-09-16 23:18:14 EDT
Data sources: NSE pre-open F&O and NSE derivatives quotes
Executive summary
As-of: 2026-09-16 23:18:14 EDT (~08:48 IST, 17 Sep 2026) — ahead of the NSE pre-open window (09:00–09:15 IST) for today's session.
Sources: NSE pre-open F&O page and NSE official derivatives quote pages (linked per name below).
- Tape: Mixed with a sector-rotation flavor — banks/FMCG firm (SBIN +2.42%, KOTAKBANK +1.27%, HINDUNILVR +1.23%), IT heavyweights weak (TCS −2.76%, INFY −1.58%).
- Data gaps (material): No NSE index trends retrieved, the market-cap movers scan returned nothing, and all five option chains timed out — every strike, expiry, and premium reference below is indicative and must be re-verified on the live NSE chain before any order.
- News: No stock-specific headlines for any covered name — treat today's moves as catalyst-blind.
Index & F&O pre-open regime
Index trends (NIFTY, BANKNIFTY, MIDCPNIFTY, FINNIFTY): No NSE index data retrieved — the index regime, breadth, and key levels cannot be confirmed from this capture. Do not assume index direction.
F&O pre-open snapshot (official):
| Name | ₹ | Chg % | Read |
|—|—|—|—|
| SBIN.NS | 991.4 | +2.42% | Bounce inside a monthly pullback |
| KOTAKBANK.NS | 415.0 | +1.27% | Monthly uptrend, flat week |
| HINDUNILVR.NS | 1,962.0 | +1.23% | Bounce vs. monthly downtrend |
| INFY.NS | 1,060.0 | −1.58% | Weak, within monthly decline |
| TCS.NS | 2,188.8 | −2.76% | Sharpest faller; unexplained |
Regime read: Rotation out of IT into financials/defensives in this snapshot, with no index confirmation and no news driver. Timing caveat: at 08:48 IST the official pre-open has not begun, so these are the feed's pre-open indications vs. prior close — expect revisions once the 09:00 IST order-entry window opens.
Largest movers by % — NSE pre-open
No NSE pre-open movers were returned by the official scan for any market-cap bucket.
- Large cap: None captured. For reference only (from the covered F&O snapshot, *not* the movers scan): widest moves are SBIN +2.42% and TCS −2.76%.
- Mid cap: None captured.
- Small cap (high risk — proceed with caution): None captured. Caution: small-cap movers are high risk — proceed with caution and use limited risk capital only, and only after core investments are secure. Thin liquidity and wide spreads make small-cap moves unreliable at the open.
Related news drivers
No headlines exist for TCS, SBIN, INFY, KOTAKBANK, or HINDUNILVR in this pull — do not infer a catalyst. What the feed did capture:
- Apple developing an enterprise AI server (M8-class chips), in talks with Nvidia (Bloomberg, Yahoo Finance, Investing.com) — a global tech-sentiment item only; not an India-specific driver and not a reason to trade Indian IT either way.
- SPDR S&P 500 ETF (SPY) Wikipedia stub and generic Moneycontrol (Gujarati)/Mint ePaper/CNBC energy pages — noise; one Moneycontrol item flags Godavari Biorefineries patent news, unrelated to covered names.
Treat the tape as a news vacuum; verify IT-sector and PSU-bank headlines before sizing anything.
NSE options structure ideas (educational only — not investment advice)
*No live chain was captured for any name (NSE read timeouts). Strikes/expiries below are indicative — confirm on the official chain pages cited. Use limit orders; avoid the first 15 minutes after the 09:15 IST open.*
TCS.NS — Primary: PUT
Official chain: https://www.nseindia.com/get-quote/derivatives/TCS/TCS
Trend: 1W −0.87% | 1M −4.0% (bearish). −2.76% pre-open, unexplained — verify whether stock-specific or sector-wide before sizing.
- Put side (primary): Put debit spread — buy ~2200 PE / sell ~2140–2120 PE. Defined risk; pays if weakness extends. Defensive alternative for holders: protective ~2160 PE. Cash-secured put near 2100 only if genuinely willing to own TCS lower.
- Call side (lower conviction): Covered call only for existing holders — sell ~2260–2280 CE above prior-close resistance (~2251). No fresh long calls against this tape.
- Tenor: Sep 24, 2026 monthly (~7 days, fast theta) or Oct 29, 2026 — October likely straddles results (event/IV risk).
SBIN.NS — Primary: CALL (tactical, defined-risk only)
Official chain: https://www.nseindia.com/get-quote/derivatives/SBIN/SBIN
Trend: 1W −0.91% | 1M −5.85% — counter-trend bounce on below-average volume; PSU-bank flow, no catalyst.
- Call side (primary): Call debit spread — buy ~990–1000 CE / sell ~1030–1040 CE; pay ≤ ~40–45% of width; take profit into 1020–1030. Holders: covered call ~1040 CE.
- Put side (lower conviction): Cash-secured ~950 PE only if willing to own SBIN at 950; protective 950–960 PE for longs.
- Tenor: Sep monthly — Tuesday, Sep 29, 2026 (inferred from the current NSE cycle; chain capture failed). A close back below ~970 negates the bounce.
INFY.NS — Primary: PUT
Official chain: https://www.nseindia.com/get-quote/derivatives/INFY/INFY
Trend: 1W +2.42% | 1M −4.93% — bounce inside a downtrend; monthly governs.
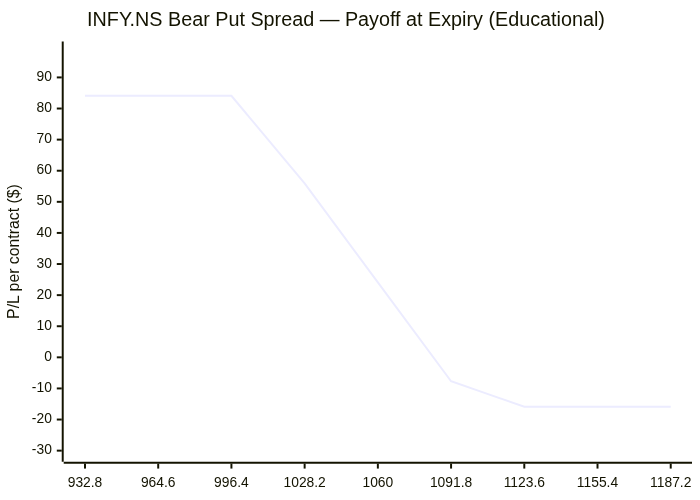
- Put side (primary): Put debit spread — buy 1060 PE / sell 1020 PE, Sep monthly. Accumulation-minded alternative: cash-secured 1000 PE only if assignment ~6% below spot is acceptable.
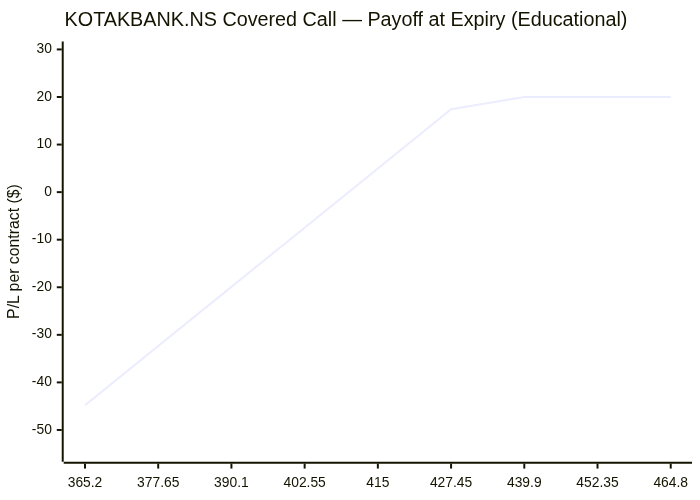
- Call side (lower conviction): Covered call — sell 1100 CE against existing stock. A 1060/1100 call debit spread is defensible only on a reclaim of 1077 (prior close).
- Tenor: Sep monthly (~Sep 29, 2026, unverified). Weekly bounce can squeeze short delta — keep size modest.
KOTAKBANK.NS — Primary: CALL
Official chain: https://www.nseindia.com/get-quote/derivatives/KOTAKBANK/KOTAKBANK
Trend: 1W +0.24% | 1M +7.06% — uptrend intact, near-term consolidation; up-move on below-average volume.
- Call side (primary): Call debit spread — buy ~415 CE / sell 430 CE; defined risk fits "bullish month / flat week." Holders: covered call 430 CE.
- Put side (income/defensive, lower conviction as a bearish bet): Cash-secured ~400 PE at round-number support; protective 410 PE or 410/395 put spread as a hedge for longs.
- Tenor: Sep monthly (~Sep 29, 2026 — confirm) or October for room through results season. Verify post-split strike grid and lot size.
HINDUNILVR.NS — Primary: CALL (low–moderate conviction)
Official chain: https://www.nseindia.com/get-quote/derivatives/HINDUNILVR/HINDUNILVR
Trend: 1W +0.87% | 1M −4.53% — a bounce trade, not a reversal; rallies into 2000–2050 have been sold.
- Call side (primary): Call debit spread — buy ~1960 CE / sell ~2020 CE, prefer October monthly (September is very near-dated; pin/theta noise). Holders: covered call 2000–2020 CE into resistance.
- Put side (lower conviction): 1940 PE / 1880 PE put debit spread only on a rejection below 1940; cash-secured ~1880 PE only if you want to own HUL there.
- Tenor: Strikes in ₹20 steps; confirm the expiry calendar on NSE (single-stock expiry conventions were revised during 2025).
Risks & watch-outs
- Data integrity: Index trends, the movers scan, and all option chains failed to load — strikes, IV, OI, bid/ask, and expiry dates above are unverified. Re-price everything on the live NSE chain before entry.
- Small-cap liquidity: No small-cap movers were captured, but the standing rule applies — small-cap movers are high risk: proceed with caution and use limited risk capital only after core investments are secure. Expect thin books, wide spreads, and slippage.
- Gap risk: Sharp pre-open moves (TCS −2.76%) are prone to intraday mean reversion — chasing bearish entries "into a hole" can get squeezed. All five names carry overnight gap risk from US sessions, and the 08:48 IST snapshot can shift materially by 09:15 IST.
- News vacuum: No captured catalysts; a single headline (IT deal wins, RBI commentary, PSU-bank/yield moves, macro prints) can flip the tape in either direction.
- Expiry risk: NSE expiry-day conventions changed recently (the notes cite both a Thursday Sep 24 and a Tuesday Sep 29 cycle) — confirm the actual expiry date on NSE. Near-dated September premium decays fast; avoid holding long premium into expiry day.
- Event risk: October series for TCS/INFY/HUL likely straddle quarterly results — IV crush and gap risk cut both ways.
- Execution: Limit orders only; check live OI/volume; avoid deep-OTM strikes and the opening 15 minutes.
*Educational structure notes only — not investment advice or a recommendation to trade.*
Visual strategy maps
Payoff curves and entry/exit zones below are educational aids — not trade instructions. Confirm with your own chart, liquidity, and risk limits.
TCS.NS: Bear Put Spread
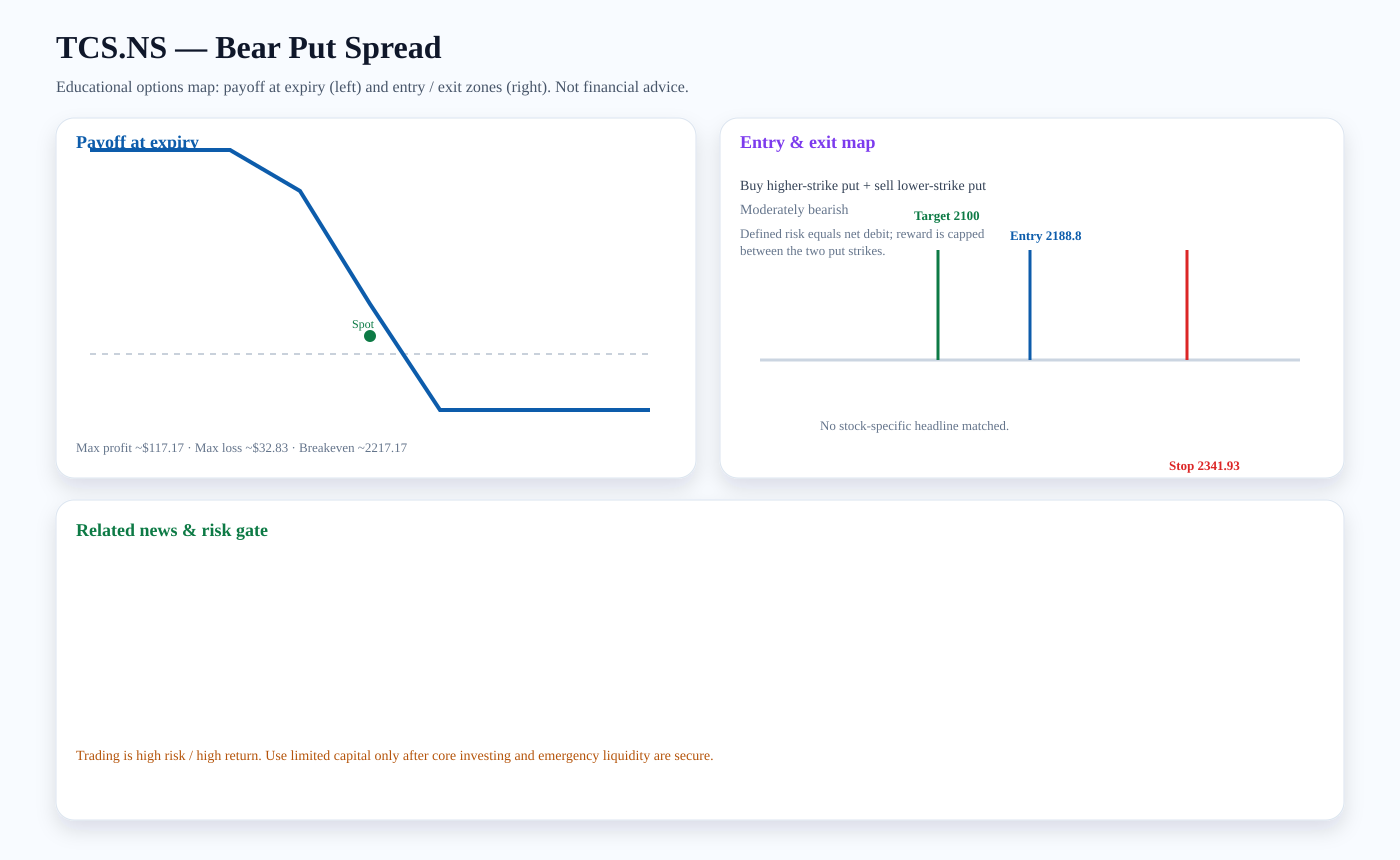
Structure: Buy higher-strike put + sell lower-strike put
Outlook: Moderately bearish
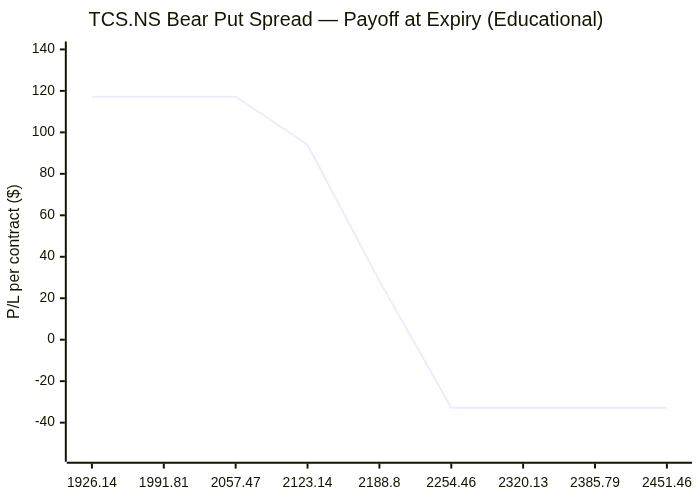
Entry zone: ~2188.8 · Target: ~2100 · Stop: ~2341.93 · Breakeven: ~2217.17
Risk note: Defined risk equals net debit; reward is capped between the two put strikes.
Payoff chart (Mermaid):
Entry / exit map (Mermaid):

SBIN.NS: Covered Call
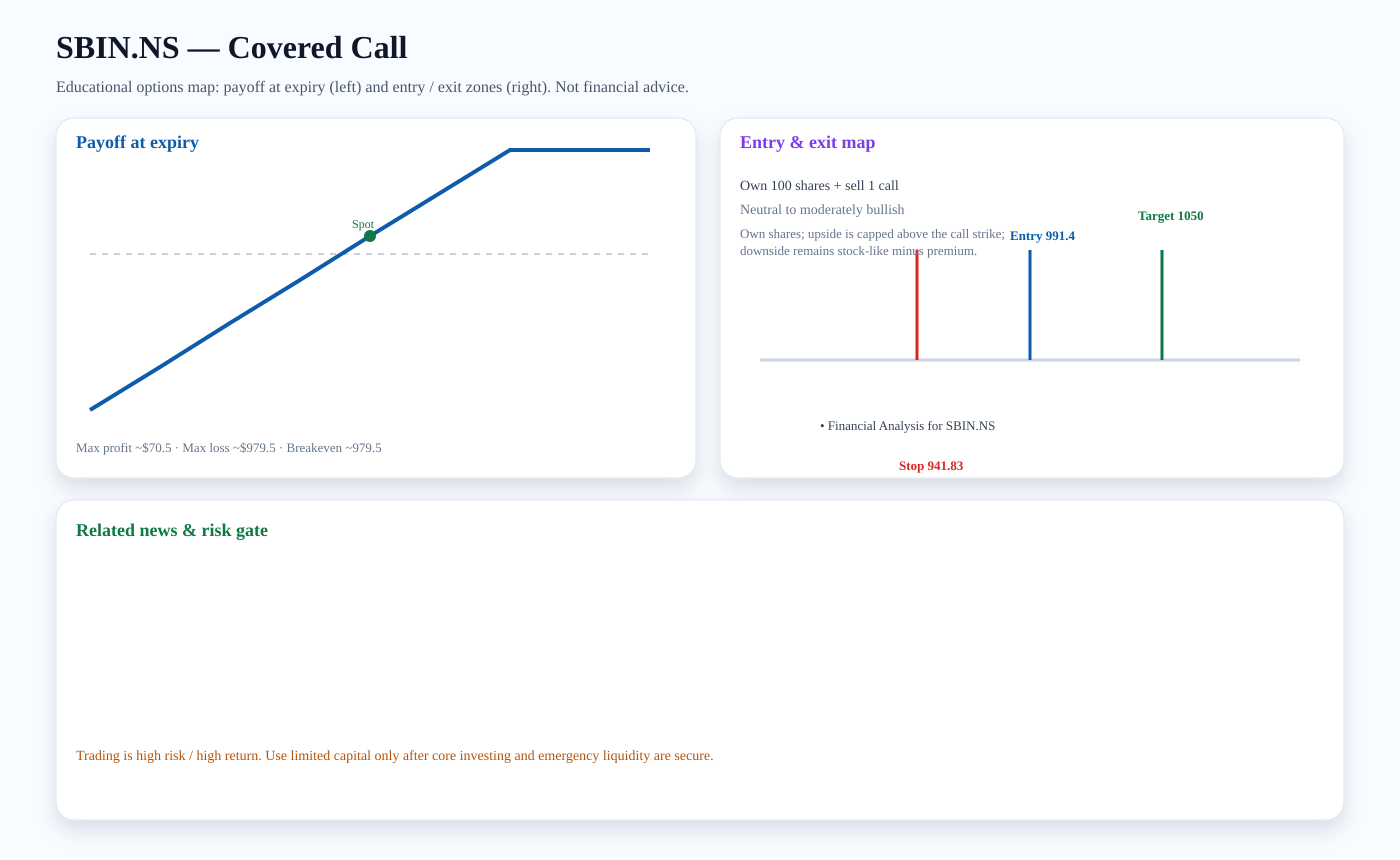
Structure: Own 100 shares + sell 1 call
Outlook: Neutral to moderately bullish
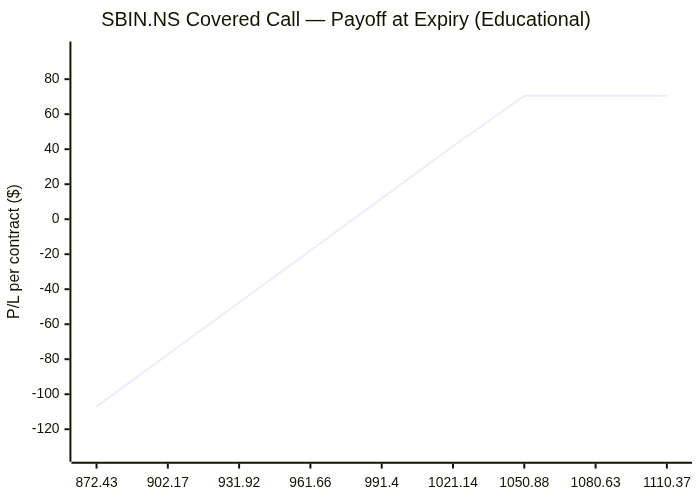
Entry zone: ~991.4 · Target: ~1050 · Stop: ~941.83 · Breakeven: ~979.5
Risk note: Own shares; upside is capped above the call strike; downside remains stock-like minus premium.
Related news links:
Payoff chart (Mermaid):
Entry / exit map (Mermaid):

INFY.NS: Bear Put Spread
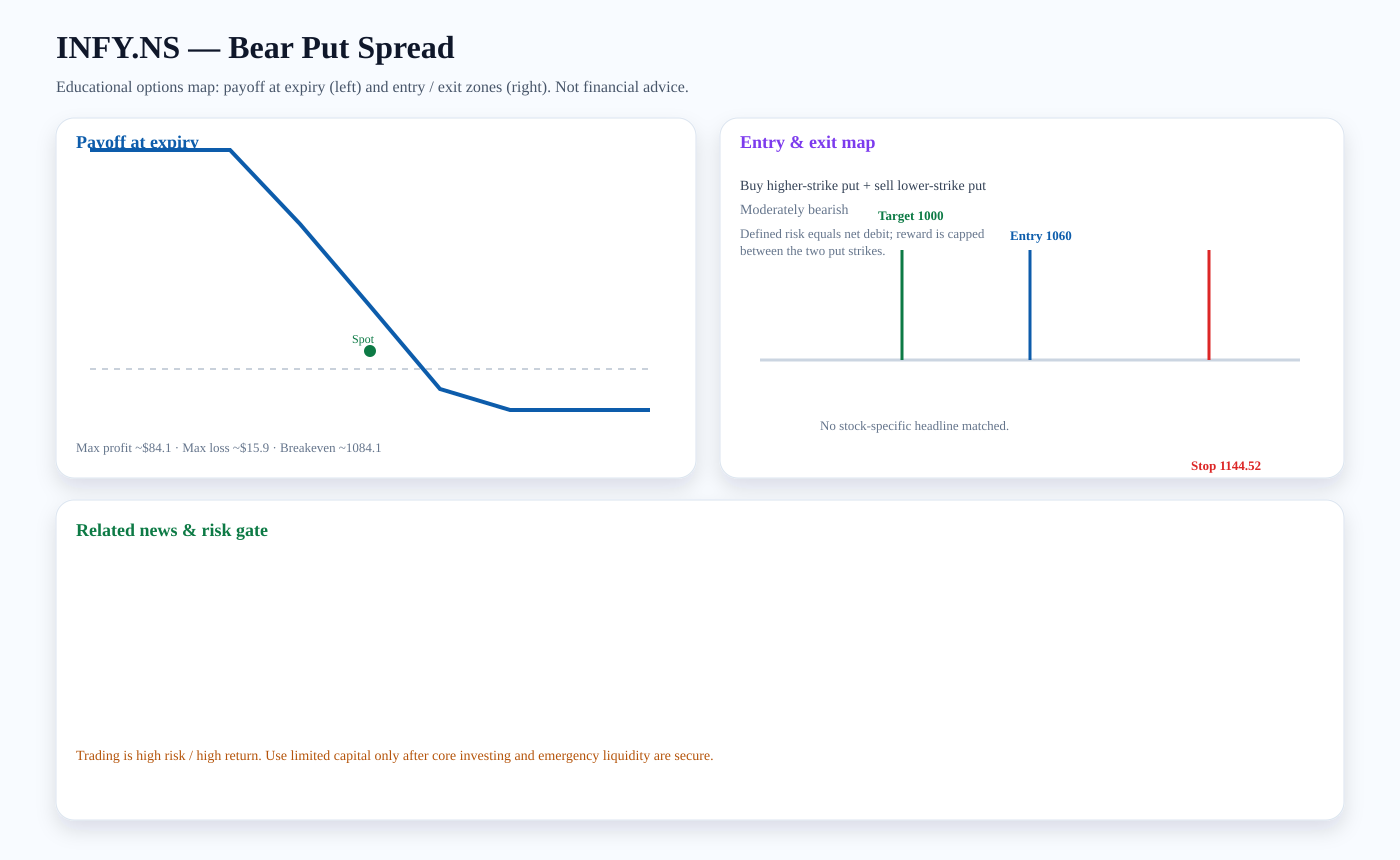
Structure: Buy higher-strike put + sell lower-strike put
Outlook: Moderately bearish
Entry zone: ~1060 · Target: ~1000 · Stop: ~1144.52 · Breakeven: ~1084.1
Risk note: Defined risk equals net debit; reward is capped between the two put strikes.
Payoff chart (Mermaid):
Entry / exit map (Mermaid):

KOTAKBANK.NS: Covered Call
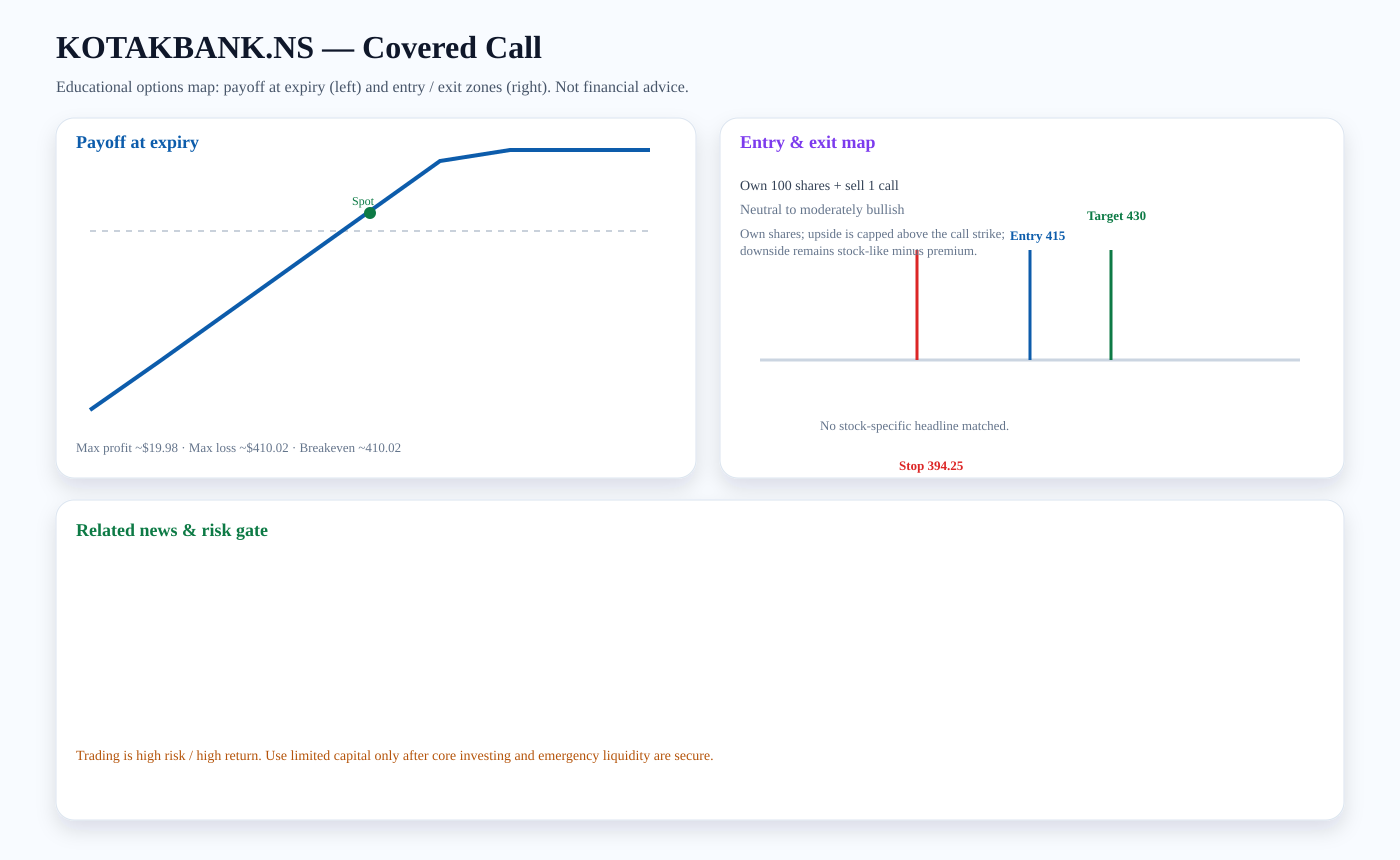
Structure: Own 100 shares + sell 1 call
Outlook: Neutral to moderately bullish
Entry zone: ~415 · Target: ~430 · Stop: ~394.25 · Breakeven: ~410.02
Risk note: Own shares; upside is capped above the call strike; downside remains stock-like minus premium.
Payoff chart (Mermaid):
Entry / exit map (Mermaid):

Trading versus investing
Investing focuses on durable ownership, diversification, and compounding. Trading seeks faster tactical returns and carries higher risk. We treat options trading as limited-capital, educational analysis only after core investment capital and emergency liquidity are protected.
PDF report — Premium
Premium members get the full PDF attached to email briefs and can download it here. Upgrade for just $2 a month.
Subscribe for $2/month