
India (NSE) Market Intelligence Brief
Report as-of (US/Eastern): 2026-07-20 05:31:00 EDT
Data sources: NSE pre-open F&O and NSE derivatives quotes
Executive summary
Report as-of (US/Eastern): 2026-07-20 05:31:00 EDT
NSE pre-open F&O data shows mixed sector rotation with banking stocks diverging sharply. HDFCBANK leads declines at -5.02% (₹778.45), while telecom and other banking names show strength. BHARTIARTL (+1.56%), SBIN (+1.47%), and ICICIBANK (+1.07%) demonstrate positive momentum. The banking sector split suggests selective institutional positioning ahead of potential earnings or policy catalysts.
Data sources: NSE pre-open F&O page and NSE official derivatives quote pages.
Index & F&O pre-open regime
No NSE index data retrieved – Unable to assess NIFTY, BANKNIFTY, or MIDCPNIFTY pre-open levels due to data connection issues.
The absence of index-level context limits broader market regime assessment, though individual F&O names suggest sector-specific rotation rather than broad market directional moves.
Largest movers by percentage
Large cap
- HDFCBANK.NS: ₹778.45 (-5.02%) – Significant gap down of ₹41.15
- KOTAKBANK.NS: ₹381.85 (-2.08%) – Banking sector weakness
- BHARTIARTL.NS: ₹1,938.5 (+1.56%) – Telecom strength
- SBIN.NS: ₹1,059.7 (+1.47%) – Banking divergence
- ICICIBANK.NS: ₹1,459.8 (+1.07%) – Positive momentum
Mid cap
No NSE pre-open movers found due to data retrieval limitations.
Small cap (high risk — proceed with caution)
No NSE pre-open movers found.
⚠️ Small-cap caution: Small-cap securities carry elevated liquidity risk and volatility. Use limited risk capital only after core portfolio investments are secure. Gap risk and wide bid-ask spreads are common in smaller names.
Related news drivers
Banking sector headlines suggest mixed fundamentals:
- HDFC Bank margin concerns: Reuters reports previous market cap losses on weak margins, potentially explaining today's -5.02% pre-market decline
- AI sector volatility: Multiple headlines reference elevated semiconductor and tech volatility, though direct NSE impact unclear
- Energy sector extremes: Crack spread dynamics may affect broader market sentiment
- Earnings wave expectations: AI CapEx themes dominating global markets, with potential spillover to Indian tech and telecom sectors
NSE options structure ideas (educational)
Primary bearish setup: HDFCBANK.NS
Primary structure: PUT debit spread
- Trend: 1W -4.83%, 1M -0.17% (accelerating weakness)
- Put spreads around ₹780/₹750 strikes for defined risk downside play
- Call-side: Covered calls only if holding shares
- Risk: Banking sector reversal, gap-fill potential
Primary bullish setups: BHARTIARTL.NS, SBIN.NS, ICICIBANK.NS
Primary structure: CALL debit spreads
- BHARTIARTL: 1W +1.93%, 1M +1.45% – consistent uptrend
- SBIN: 1W +2.19%, 1M +2.38% – momentum continuation
- ICICIBANK: 1W +3.57%, 1M +8.41% – strongest trend
- Call spreads targeting 2-4 week expiries for trend capture
- Put-side: Cash-secured puts below support for income
⚠️ Options chain limitation: NSE derivatives data connection timeout prevents precise strike and liquidity verification. Confirm bid-ask spreads before execution.
Risks & watch-outs
Market structure risks:
- Index data unavailability limits broader context assessment
- Options chain access issues prevent liquidity verification
- Banking sector divergence suggests sector-specific catalysts
Execution risks:
- Small-cap liquidity: Limited small-cap data available; expect wide spreads and gap risk
- Options liquidity: Cannot verify bid-ask spreads due to NSE connection issues
- Currency exposure: INR fluctuation risk for non-domestic traders
Fundamental risks:
- Banking margin pressure (HDFC-specific but sector contagion possible)
- Policy announcement sensitivity in financial sector
- Global AI/tech volatility spillover to Indian markets
- Earnings season positioning ahead of results
Recommended approach: Verify all options parameters and underlying liquidity before execution. Focus on liquid large-cap names with confirmed options volume.
Visual strategy maps
Payoff curves and entry/exit zones below are educational aids — not trade instructions. Confirm with your own chart, liquidity, and risk limits.
HDFCBANK.NS: Bear Put Spread
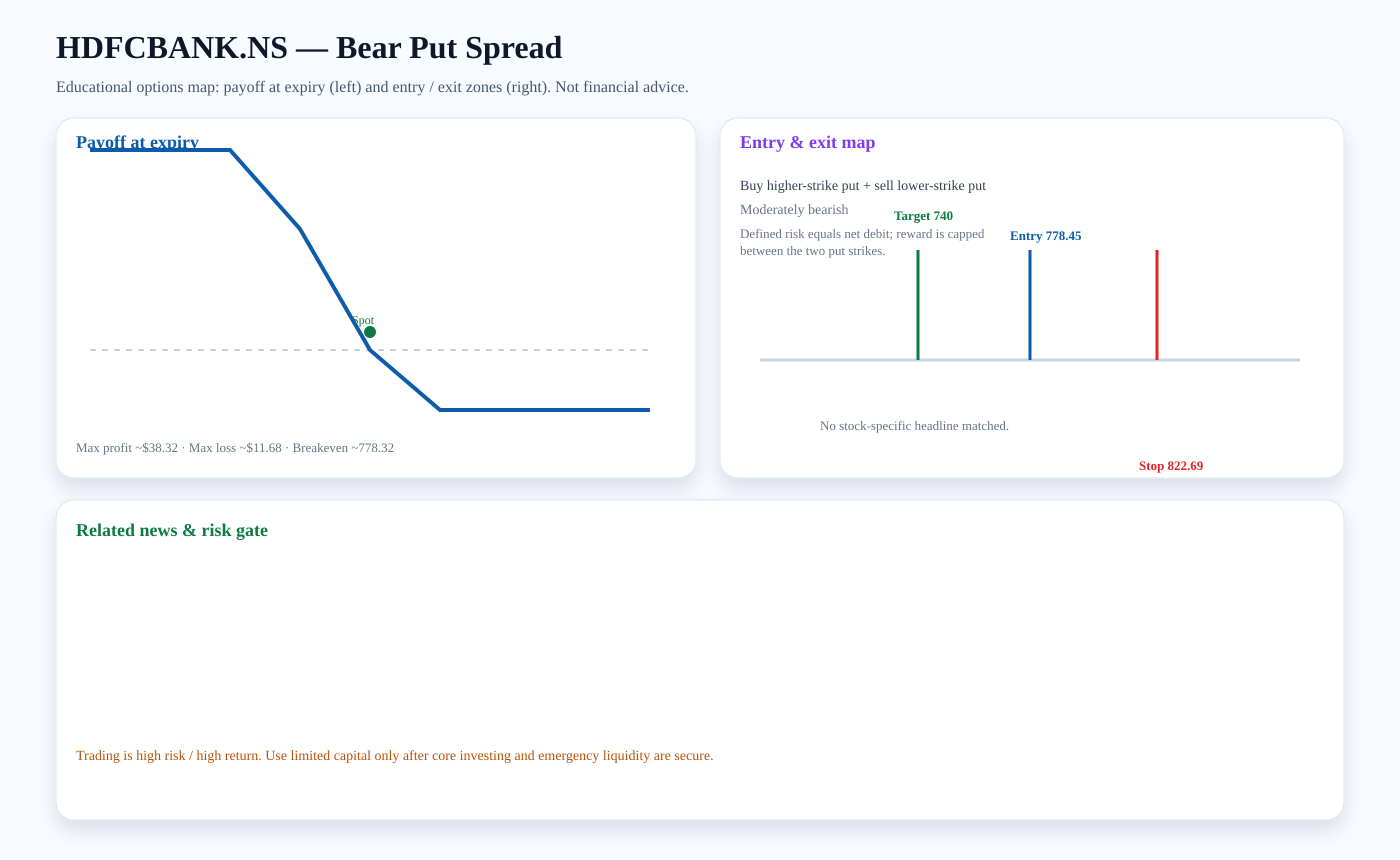
Structure: Buy higher-strike put + sell lower-strike put
Outlook: Moderately bearish
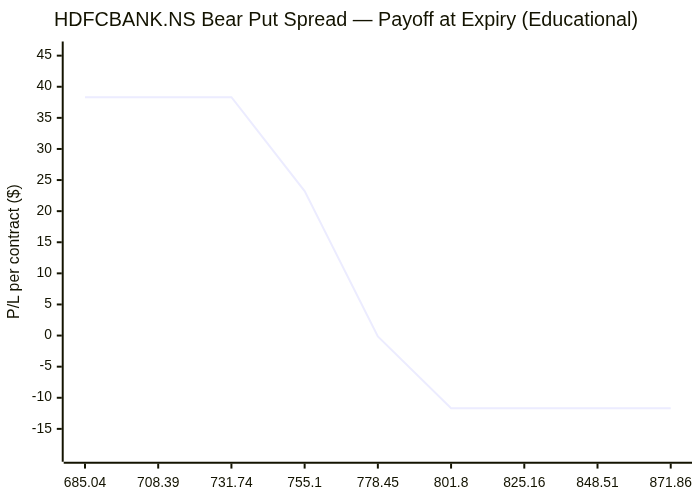
Entry zone: ~778.45 · Target: ~740 · Stop: ~822.69 · Breakeven: ~778.32
Risk note: Defined risk equals net debit; reward is capped between the two put strikes.
Payoff chart (Mermaid):
Entry / exit map (Mermaid):

KOTAKBANK.NS: Bear Put Spread
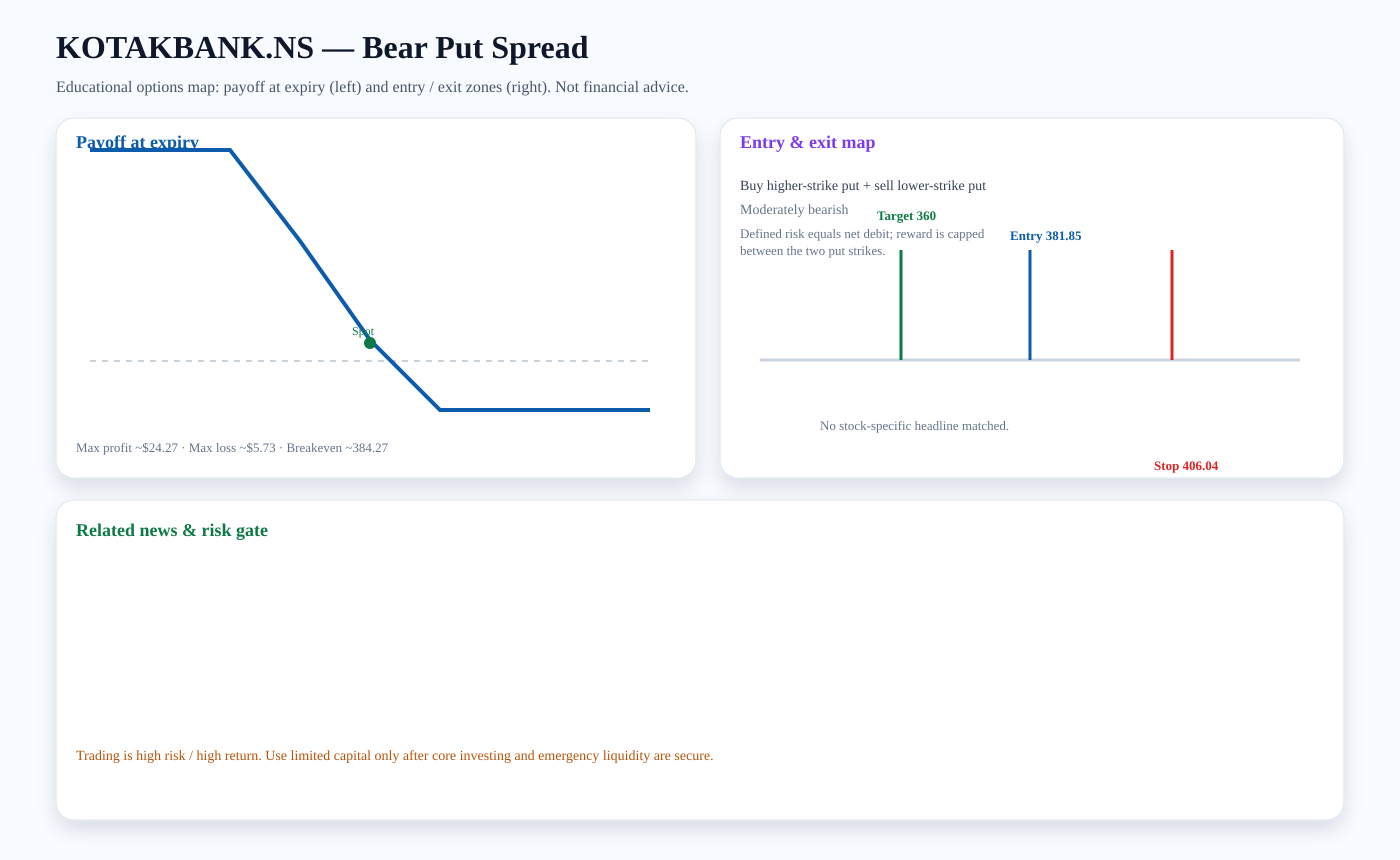
Structure: Buy higher-strike put + sell lower-strike put
Outlook: Moderately bearish
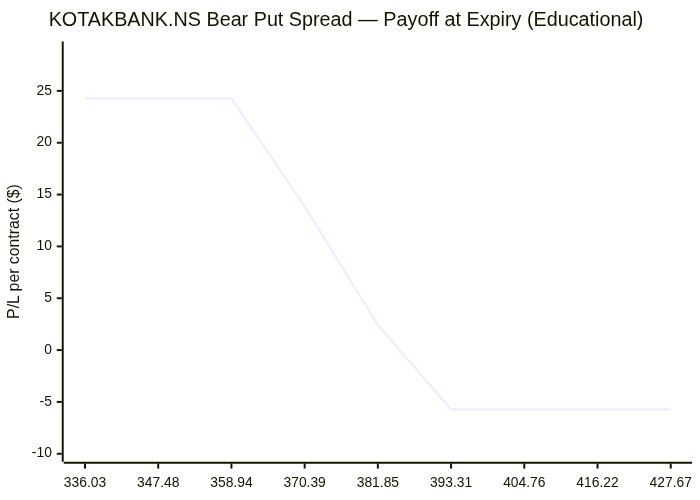
Entry zone: ~381.85 · Target: ~360 · Stop: ~406.04 · Breakeven: ~384.27
Risk note: Defined risk equals net debit; reward is capped between the two put strikes.
Payoff chart (Mermaid):
Entry / exit map (Mermaid):

BHARTIARTL.NS: Bull Call Spread
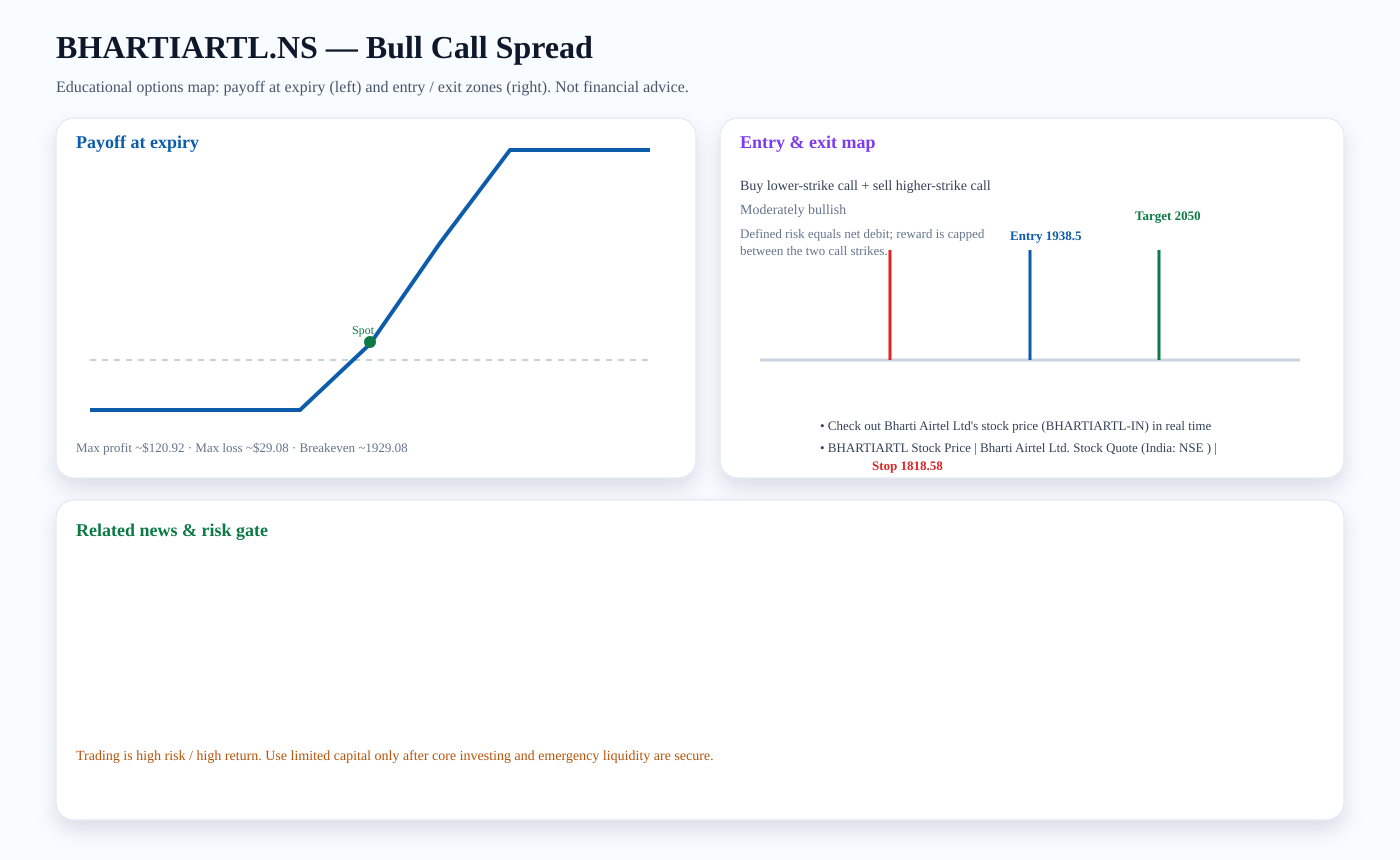
Structure: Buy lower-strike call + sell higher-strike call
Outlook: Moderately bullish
Entry zone: ~1938.5 · Target: ~2050 · Stop: ~1818.58 · Breakeven: ~1929.08
Risk note: Defined risk equals net debit; reward is capped between the two call strikes.
Related news links:
Payoff chart (Mermaid):
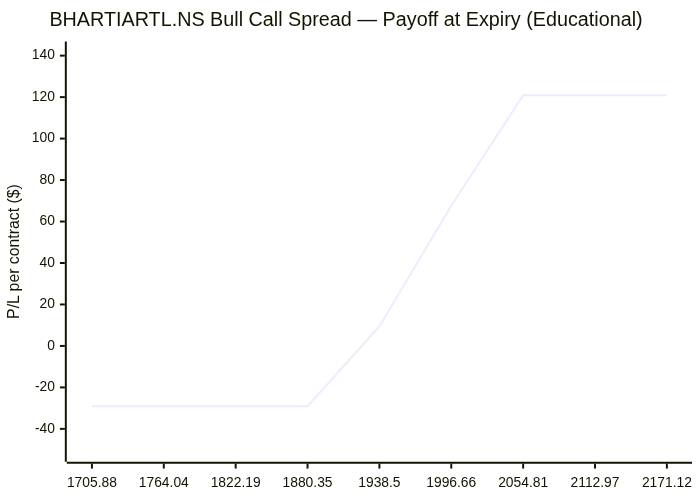
Entry / exit map (Mermaid):

SBIN.NS: Bull Call Spread
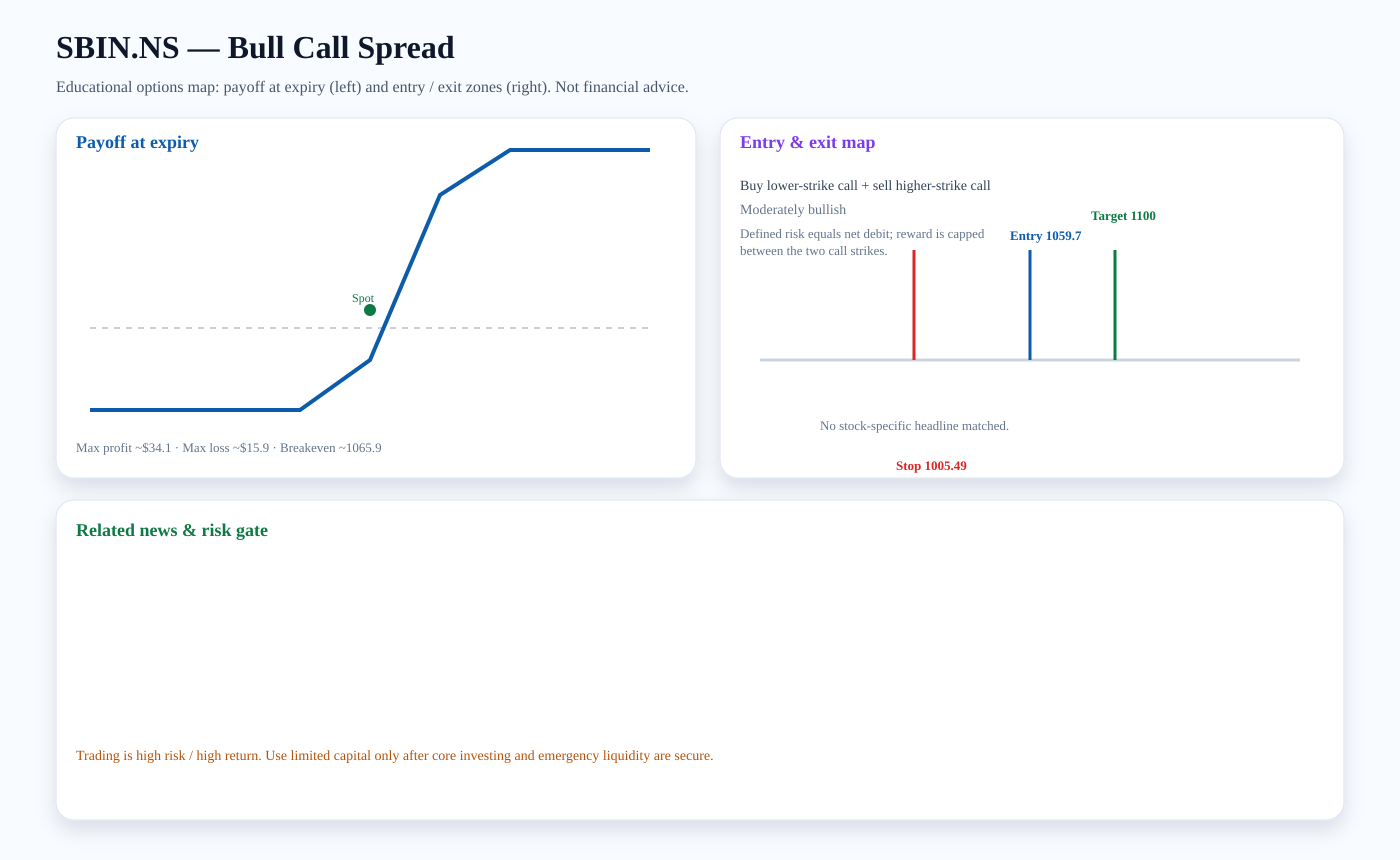
Structure: Buy lower-strike call + sell higher-strike call
Outlook: Moderately bullish
Entry zone: ~1059.7 · Target: ~1100 · Stop: ~1005.49 · Breakeven: ~1065.9
Risk note: Defined risk equals net debit; reward is capped between the two call strikes.
Payoff chart (Mermaid):
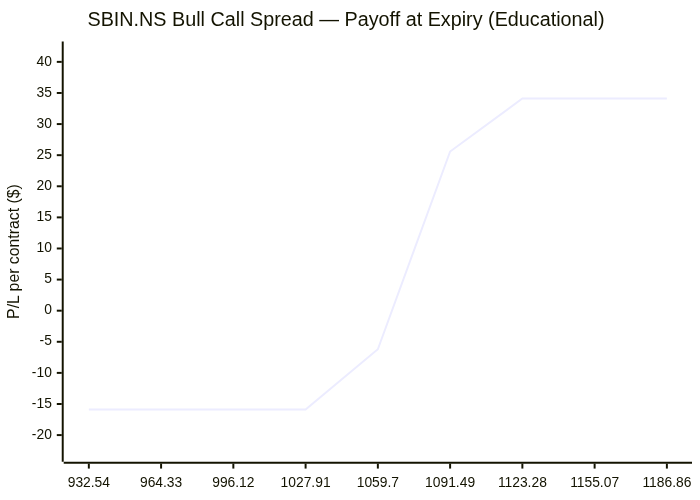
Entry / exit map (Mermaid):

Trading versus investing
Investing focuses on durable ownership, diversification, and compounding. Trading seeks faster tactical returns and carries higher risk. We treat options trading as limited-capital, educational analysis only after core investment capital and emergency liquidity are protected.
PDF report — Premium
Premium members get the full PDF attached to email briefs and can download it here. Upgrade for just $2 a month.
Subscribe for $2/month