
India (NSE) Market Intelligence Brief
Report as-of (US/Eastern): 2026-07-21 23:18:45 EDT
Data sources: NSE pre-open F&O and NSE derivatives quotes
Executive summary
Report as-of (US/Eastern): 2026-07-21 23:18:45 EDT
NSE markets show broad-based weakness in pre-open F&O trading, with major large-cap names declining 1-2%. HDFCBANK leads losses at -2.08%, followed by RELIANCE (-1.47%), SBIN (-1.47%), TCS (-1.33%), and INFY (-1.25%). Banking and IT sectors appear under pressure. Options structures favor put-side strategies given the bearish momentum, though data limitations from NSE connectivity issues restrict precise strike analysis.
Data sources: NSE pre-open F&O page and NSE official derivatives quote pages.
Index & F&O pre-open regime
No NSE index data retrieved – Official NSE derivative index trends unavailable due to data connectivity issues. This limits our ability to assess broader market regime (NIFTY, BANKNIFTY, MIDCPNIFTY) and sectoral rotation patterns.
Largest movers by %
Large cap
- HDFCBANK.NS: ₹761.45 (-2.08%) – Leading declines among major names
- RELIANCE.NS: ₹1303.7 (-1.47%) – Weakness despite recent resilience
- SBIN.NS: ₹1044.4 (-1.47%) – Banking sector pressure evident
- TCS.NS: ₹2221.1 (-1.33%) – IT mega-cap under pressure
- INFY.NS: ₹1073.5 (-1.25%) – Continuing weekly weakness
Mid cap
No NSE pre-open movers found – Data unavailable for mid-cap segment analysis.
Small cap (high risk — proceed with caution)
No NSE pre-open movers found – Small-cap data unavailable. Caution advised: Small-cap investments carry high risk and should only be considered with limited risk capital after core investments are secure.
Related news drivers
Limited India-specific news captured. Headlines focus primarily on:
- HDFC AMC coverage from Moneycontrol
- NIFTY BANK technical analysis and support/resistance levels
- General market updates from Moneycontrol showing Asian markets mixed sentiment
Note: Most captured headlines relate to US tech/semiconductor stocks (Apple AI, Applied Materials) which may have indirect impact on Indian IT sector sentiment.
NSE options structure ideas (educational)
Primary bearish structures recommended:
- HDFCBANK.NS: Put debit spreads targeting ₹740-720 range (primary bias: bearish given -5.92% weekly decline)
- RELIANCE.NS: Put debit spreads around ₹1300 level (mixed signals but gap-down reinforces near-term weakness)
- TCS.NS: Put debit spreads targeting ₹2200-2150 (bearish despite strong monthly trend)
Call-side opportunities:
- Covered calls on existing positions to generate income during weakness
- Wait for bounce confirmation before initiating new call structures given broad-based selling
Critical limitation: NSE options chain data unavailable due to connection timeouts – precise strike selection and liquidity assessment not possible.
Risks & watch-outs
Immediate risks:
- Data connectivity issues with NSE limiting real-time options analysis
- Broad-based selling across quality large-caps suggests systematic pressure
- Banking sector weakness (HDFC, SBI) may signal broader financial stress
Structural risks:
- Small-cap liquidity risk – Limited data available; exercise extreme caution with smaller names
- Gap risk – Pre-open weakness may accelerate at market open
- Currency exposure for non-INR traders given sustained selling pressure
- Options liquidity unknown due to NSE data retrieval failures
Key watch-outs:
- Monitor for gap-fill rallies that could reverse put strategies quickly
- Banking sector policy/rate sensitivity given HDFC/SBI weakness
- IT sector earnings expectations amid TCS/INFY declines
- Verify current options chains directly through NSE before execution due to data limitations
Visual strategy maps
Payoff curves and entry/exit zones below are educational aids — not trade instructions. Confirm with your own chart, liquidity, and risk limits.
HDFCBANK.NS: Bear Put Spread
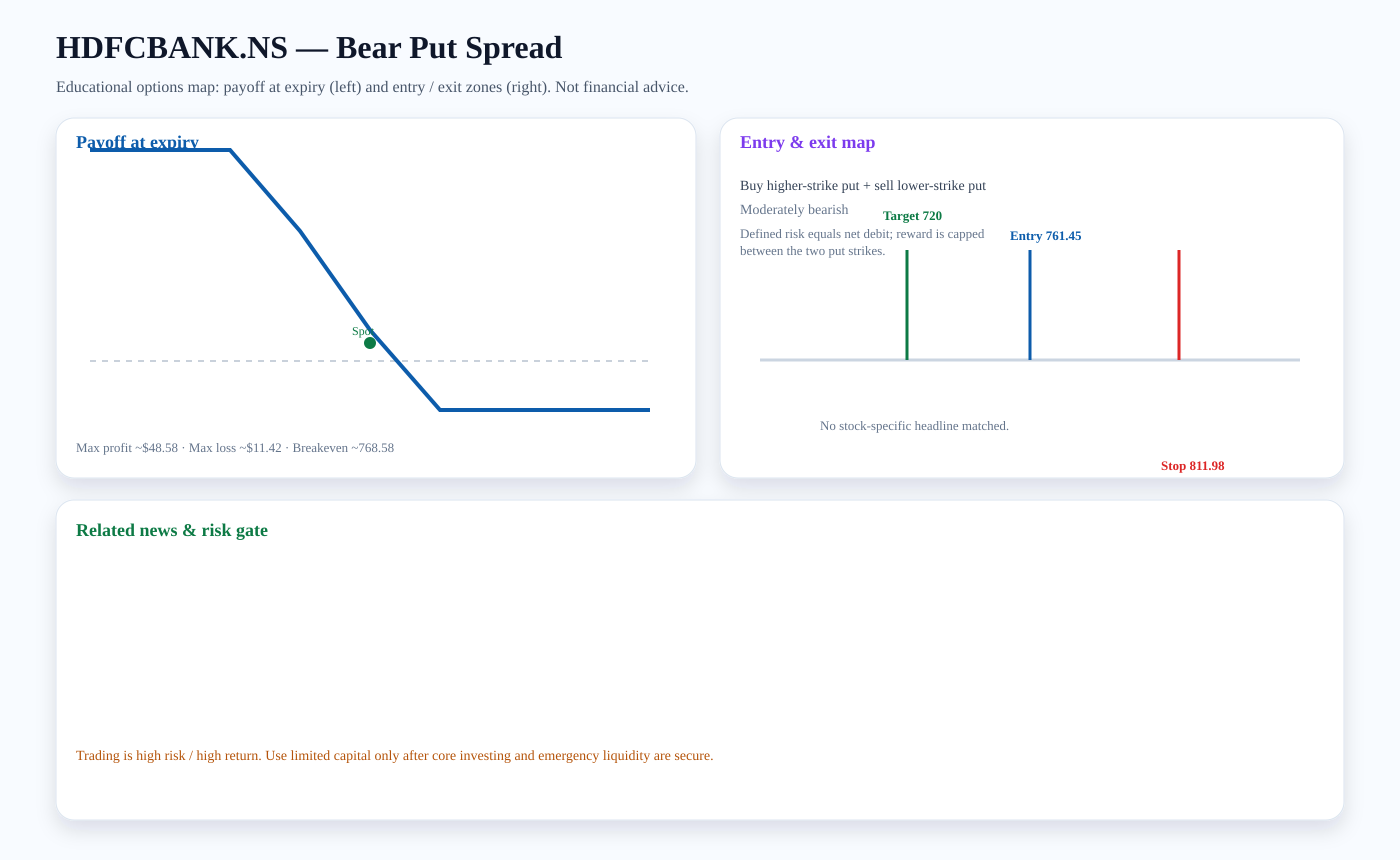
Structure: Buy higher-strike put + sell lower-strike put
Outlook: Moderately bearish
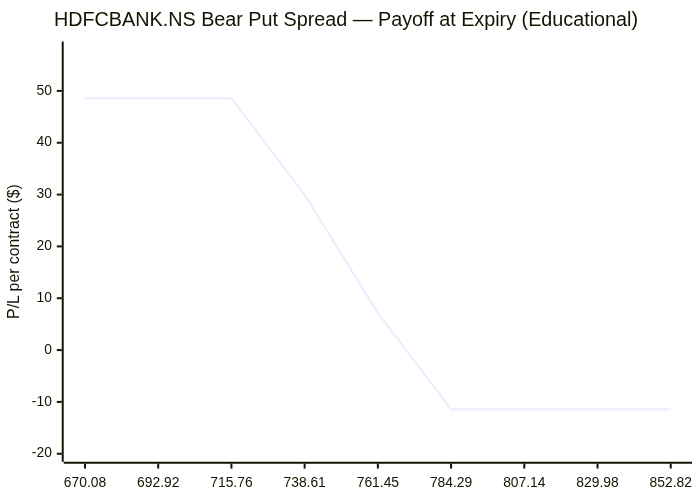
Entry zone: ~761.45 · Target: ~720 · Stop: ~811.98 · Breakeven: ~768.58
Risk note: Defined risk equals net debit; reward is capped between the two put strikes.
Payoff chart (Mermaid):
Entry / exit map (Mermaid):

RELIANCE.NS: Bear Put Spread
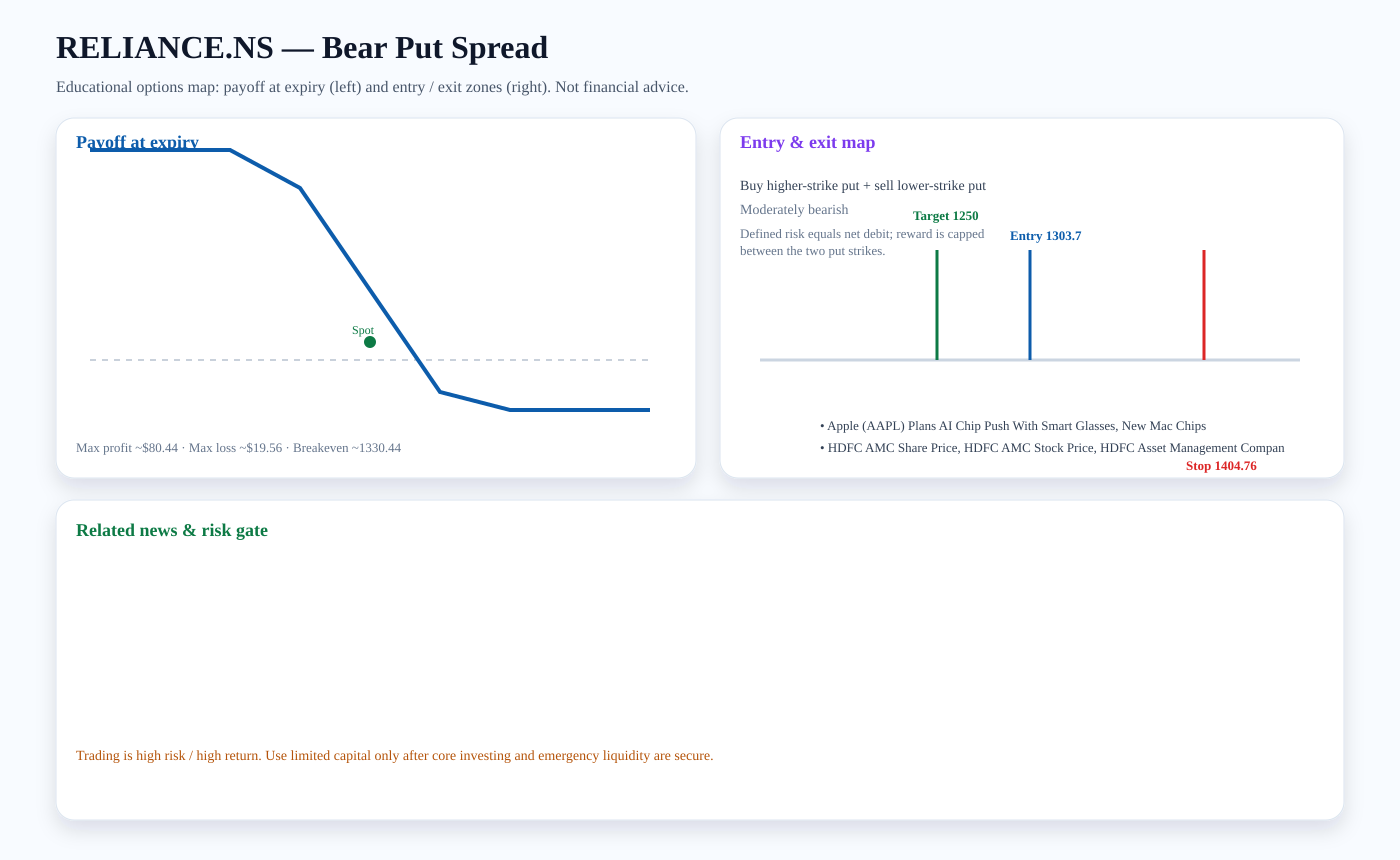
Structure: Buy higher-strike put + sell lower-strike put
Outlook: Moderately bearish
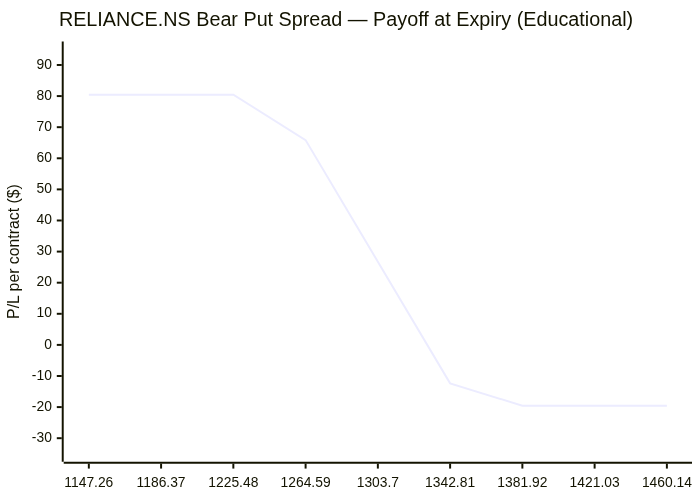
Entry zone: ~1303.7 · Target: ~1250 · Stop: ~1404.76 · Breakeven: ~1330.44
Risk note: Defined risk equals net debit; reward is capped between the two put strikes.
Related news links:
Payoff chart (Mermaid):
Entry / exit map (Mermaid):

SBIN.NS: Bear Put Spread
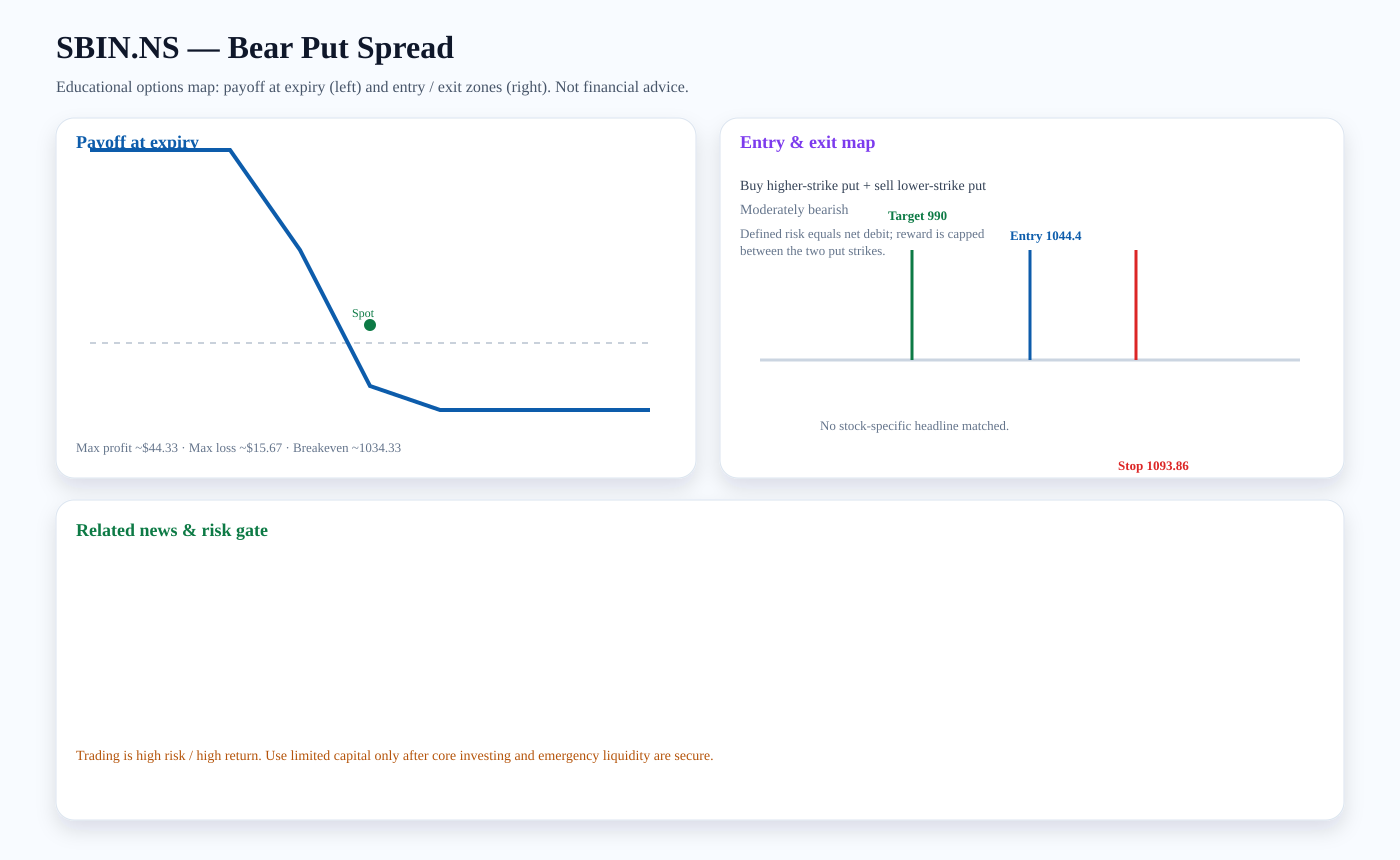
Structure: Buy higher-strike put + sell lower-strike put
Outlook: Moderately bearish
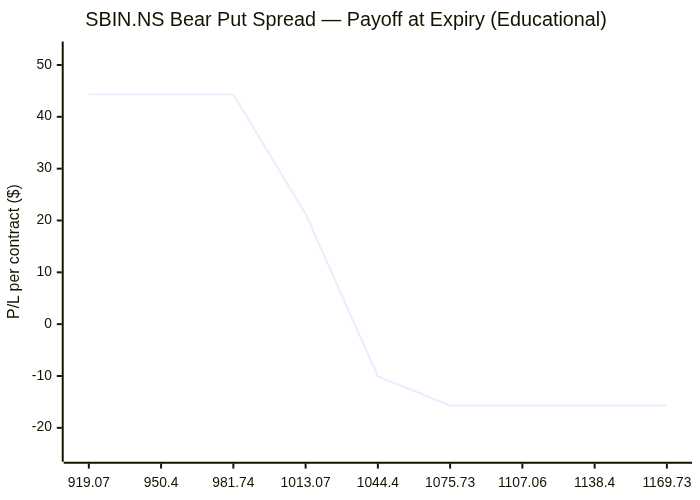
Entry zone: ~1044.4 · Target: ~990 · Stop: ~1093.86 · Breakeven: ~1034.33
Risk note: Defined risk equals net debit; reward is capped between the two put strikes.
Payoff chart (Mermaid):
Entry / exit map (Mermaid):

TCS.NS: Bear Put Spread
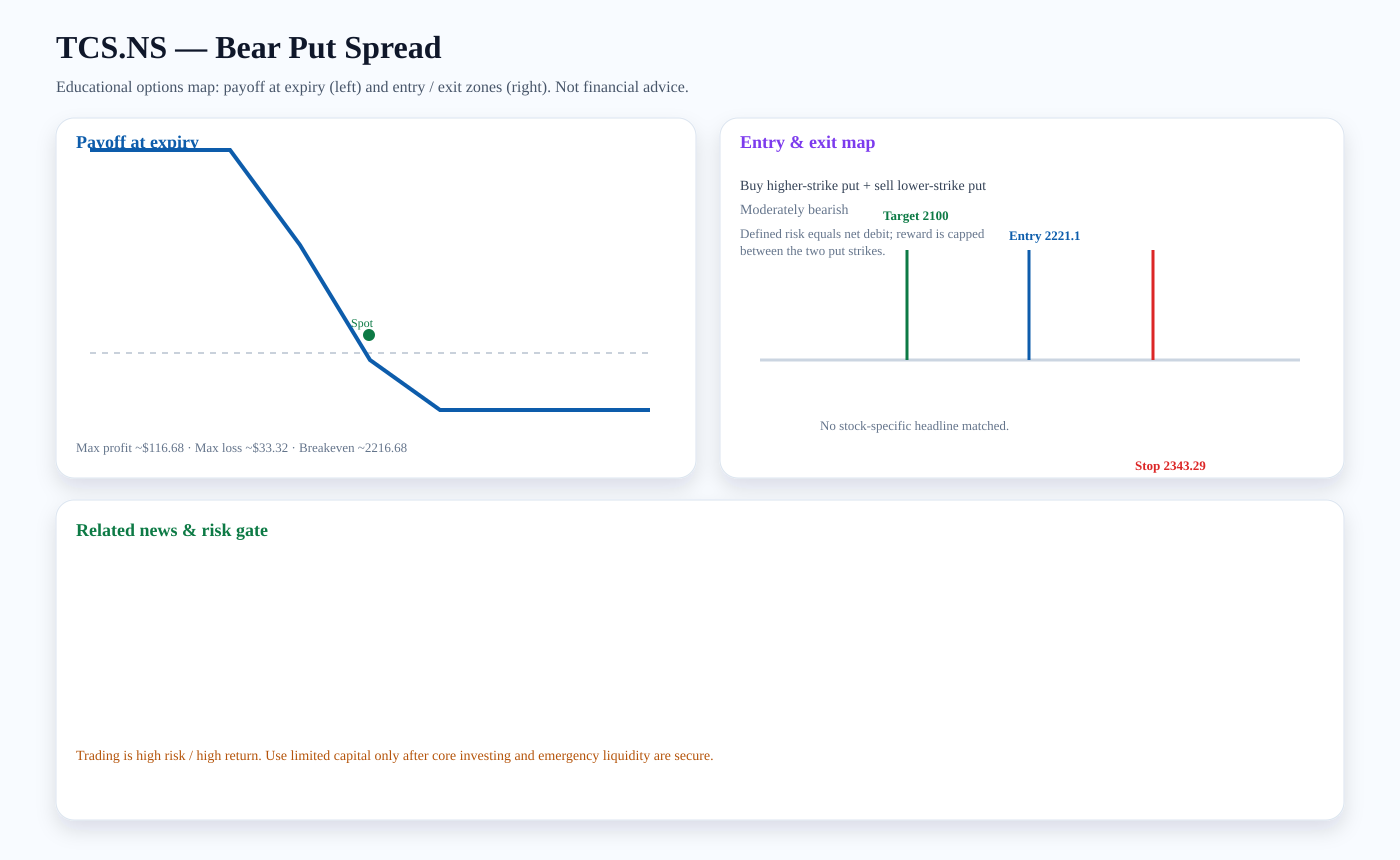
Structure: Buy higher-strike put + sell lower-strike put
Outlook: Moderately bearish
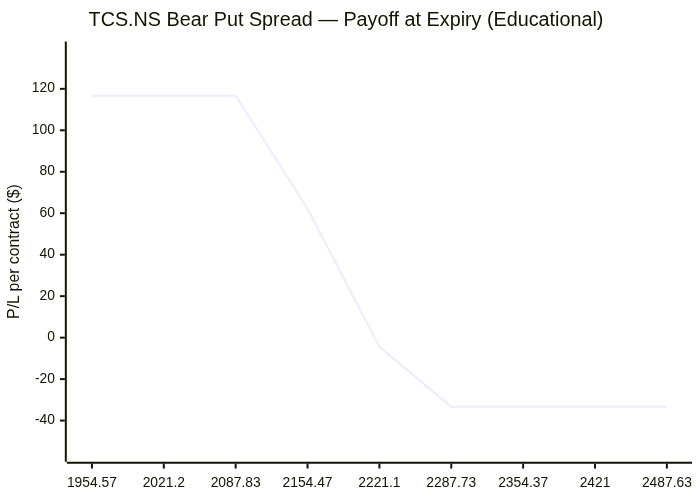
Entry zone: ~2221.1 · Target: ~2100 · Stop: ~2343.29 · Breakeven: ~2216.68
Risk note: Defined risk equals net debit; reward is capped between the two put strikes.
Payoff chart (Mermaid):
Entry / exit map (Mermaid):

Trading versus investing
Investing focuses on durable ownership, diversification, and compounding. Trading seeks faster tactical returns and carries higher risk. We treat options trading as limited-capital, educational analysis only after core investment capital and emergency liquidity are protected.
PDF report — Premium
Premium members get the full PDF attached to email briefs and can download it here. Upgrade for just $2 a month.
Subscribe for $2/month