
India (NSE) Market Intelligence Brief
Report as-of (US/Eastern): 2026-09-28 05:30:31 EDT
Data sources: NSE pre-open F&O and NSE derivatives quotes
Executive summary
As-of: 2026-09-28 05:30:31 EDT (≈ 15:00 IST — late in the Monday NSE cash session; treat prints as near-close, not pre-open gaps).
- Tape: Broad, synchronized risk-off across NSE F&O heavyweights — all five captured names down −1.9% to −2.4%, with weekly *and* monthly trends negative in every case. This reads as index-level distribution, not idiosyncratic rotation (defensives like HUL fell alongside banks).
- Bias: Bearish short-horizon across the board. Primary structures: defined-risk put debit spreads in the October monthly series. Call-side = covered calls for existing holders only; directional call debit spreads are counter-trend and low-conviction.
- Data integrity flags: (1) No NSE index data retrieved; (2) no segregated pre-open movers captured; (3) all NSE option-chain pulls failed (read timeout) — no live expiries, strikes, IV, OI, or bid/ask; (4) news scrape returned mostly generic quote pages with no stock-specific catalysts for any of the five names. All structures below are frameworks to be re-validated against the live chain before any order.
- Sources: NSE pre-open F&O page; NSE official derivatives quote pages (linked per name below).
Index & F&O pre-open regime
No NIFTY / BANKNIFTY / MIDCPNIFTY index data was retrieved in this run — regime is inferred from the official F&O snapshot only:
| Symbol | Last (₹) | vs Prior Close | 1W | 1M | Read |
|—|—|—|—|—|—|
| HINDUNILVR | 1,896.5 | −2.39% | −2.59% | −5.67% | Defensive also sold → broad risk-off |
| HDFCBANK | 718.8 | −2.28% | −2.80% | −0.21% | Pullback inside flat monthly tape |
| RELIANCE | 1,198.8 | −2.22% | −3.90% | −6.85% | Above-avg volume on down day = distribution; heavy index weight drags NIFTY |
| SBIN | 961.7 | −2.17% | −3.45% | −8.20% | PSU-bank momentum breakdown |
| ICICIBANK | 1,301.4 | −1.91% | −3.24% | −8.53% | Sitting on the 1,300 round number after steady bleed |
Regime read: Three of five are banks/financials — implies pressure on BANKNIFTY-type exposure; HUL's participation argues against a "rotation into defensives" narrative. With all five monthly trends negative and accelerating in RELIANCE/SBIN/ICICIBANK, the burden of proof is on the bulls. Caveat: with no index prints, no advance/decline, and no movers list, conviction on market-wide breadth is low.
Largest movers by %
No NSE pre-open movers were captured in this run. For completeness, using the F&O snapshot (all mega/large-cap F&O constituents):
- Large cap: HINDUNILVR −2.39% | HDFCBANK −2.28% | RELIANCE −2.22% | SBIN −2.17% | ICICIBANK −1.91% — all lower; no gainers captured.
- Mid cap: None captured — data unavailable.
- Small cap (high risk — proceed with caution): None captured — data unavailable.
> ⚠️ Small-cap caution (standing guidance): Small-cap movers are high risk. Proceed with caution and use limited risk capital only, and only after core investments are secure. Small-cap names carry thin liquidity, wide spreads, and gap risk that can overwhelm stop-losses.
Related news drivers
Only items with genuine headlines are listed; no stock-specific catalysts were found for any of the five F&O names (the MarketWatch/SBIN/HUL items returned were generic quote pages — excluded, not treated as news).
- Asia chip stocks slide as OpenAI pause revives AI doubts (ng.investing.com) — renewed concern over AI development pace hit Asian chipmakers Monday. Read-across: sentiment headwind for Indian IT/AI-linked names and global risk appetite; consistent with today's broad NSE weakness, though no direct link is confirmed.
- India's AI enablers surge as data-centre buildout gathers pace (livemint.com) — Indian investors are expressing AI exposure via power, data centres, electrical equipment and infrastructure rather than pure-play AI. A live structural theme — watch power/capex names as potential relative-strength pockets against the weak tape.
- "Awaiting the Pivot Back to Precious and Critical Minerals" (investing.com, opinion) — argues the macro cycle is turning back toward gold/critical minerals and away from crowded AI/semi trades. Opinion only; relevant as rotation context, not a catalyst.
None of the five snapshot names has an identifiable headline driver in this capture — treat today's moves as flow/technical until a real catalyst (results, RBI/policy, crude/GRM for RELIANCE) is confirmed.
NSE options structure ideas (educational only — not investment advice)
Common context: All NSE chain pulls failed (read timeout) — no live expiry, strikes, IV, OI, or bid/ask was captured. The September monthly series is at/near expiry this week; the practical tenor for all structures is the next monthly series (~late-October expiry). Confirm exact expiry dates, strike grids, and lot sizes on the live NSE chain before entry. Limit orders at mid only; avoid the first 15–30 minutes of the session. Primary side in all five names: PUT. Call-side is covered-call-only, lower conviction.
HINDUNILVR — primary: PUT
*Official chain:* https://www.nseindia.com/get-quote/derivatives/HINDUNILVR/HINDUNILVR
- Put debit spread: buy ~₹1,900 PE / sell ~₹1,840 PE, October monthly. Risk = net debit; exit on reclaim of ₹1,942.9 (prior close) or at ~70–80% of max value.
- Call-side (holders only): covered call ~₹1,950–2,000 CE to harvest premium in the downtrend.
- Watch: FMCG mean-reversion bounces; results typically second half of October (inside the October window).
HDFCBANK — primary: PUT
*Official chain:* https://www.nseindia.com/get-quote/derivatives/HDFCBANK/HDFCBANK
- Put debit spread: buy ~₹720 PE / sell ~₹700 PE (cheaper: ₹710/₹690). Invalidation: reclaim of ~₹735.6 prior close.
- Call-side (holders only): covered call ~₹740–750 CE. Call debit spreads only if ₹735–740 is reclaimed and held.
- Note: monthly trend is flat (−0.21%) — this is a pullback in a sideways tape, so modest targets; "mystery gap" with no confirmed catalyst demands smaller size.
RELIANCE — primary: PUT
*Official chain:* https://www.nseindia.com/get-quote/derivatives/RELIANCE/RELIANCE
- Put debit spread: buy ~₹1,200 PE / sell ~₹1,160 PE (cheaper: ₹1,180/₹1,140). Spread monetizes elevated put skew; avoid naked long puts. Above-average volume on the down day supports the distribution read.
- Call-side (holders only): covered call ~₹1,240–1,260 CE. Cash-secured puts are bullish-entry tactics — only if you genuinely want stock near ₹1,150–1,160.
- Watch: October results risk, crude/GRM swings, heavy Nifty weight (beta to index risk-off).
SBIN — primary: PUT
*Official chain:* https://www.nseindia.com/get-quote/derivatives/SBIN/SBIN
- Put debit spread: buy ~₹960 PE / sell ~₹940 PE (widen short leg to ₹930 for more runway), October monthly. Take profits into the ₹940–930 zone rather than holding for max payout.
- Call-side (holders only): covered call ~₹1,000 CE (above prior close ₹983 and round-number supply). Call debit spread only on a sustained reclaim of ₹983.
- Alternative: protective put (~₹940–950 PE) for core holders instead of selling into weakness.
ICICIBANK — primary: PUT
*Official chain:* https://www.nseindia.com/get-quote/derivatives/ICICIBANK/ICICIBANK
- Put debit spread: buy ~₹1,300 PE / sell ~₹1,250 PE, October monthly; targets continuation toward ₹1,260–1,250. Short leg offsets elevated put premium after a −8.5% month.
- Call-side (holders only): covered call ~₹1,350 CE (or ₹1,380 for room). A ₹1,300/₹1,360 call debit spread is strictly an oversold-bounce trade — lowest conviction of the set.
- Note: spot is pinned on the 1,300 strike into the September series expiry — expect extreme pin/gamma behavior there; stay in October.
Risks & watch-outs
- Data risk (highest priority): This report is built without index data, without a movers list, without any live option chain, and without stock-specific news. Every strike, expiry, and liquidity assumption must be verified on the official NSE quote/chain pages before execution. Do not assume expiries or lot sizes.
- Mean-reversion risk: RELIANCE −6.85%, SBIN −8.2%, ICICIBANK −8.53% on the month — chasing puts late in stretched moves is vulnerable to violent short-covering rallies. Defined-risk spreads cap the loss; position size still matters.
- Event risk: Q2 earnings typically land mid/late October and RBI policy commentary often falls in early October — both inside the October expiry window. Expect IV to stay bid into results; IV crush cuts both ways on debit spreads.
- Expiry risk: The September monthly series expires within ~1 session. Do not use it — pin/gamma/theta risk is extreme (especially ICICIBANK at the 1,300 strike). Using the wrong series concentrates an entire trade's risk into hours.
- Gap risk: Moves today are untagged to any catalyst — headline risk runs both directions overnight (global AI sentiment, crude, PSU-bank/policy headlines). Gaps can jump stop-losses and spread exits.
- Small-cap liquidity risk: No small-cap movers were captured today, but the standing caution applies: small-cap movers are high risk — proceed with caution, use limited risk capital only, and only after core investments are secure. Thin books and wide spreads make exits unreliable in fast tapes.
- Execution risk: With −2% moves across heavyweights, expect wider-than-normal opening spreads. Limit orders at/near mid only, no market orders, avoid deep OTM/ITM wings, and re-check OI at chosen strikes.
*This report is educational market analysis, not personalized investment advice or a recommendation to trade. Options involve risk of loss, including the full debit on defined-risk structures. Confirm all live data on official NSE pages and size within your own risk limits.*
Visual strategy maps
Payoff curves and entry/exit zones below are educational aids — not trade instructions. Confirm with your own chart, liquidity, and risk limits.
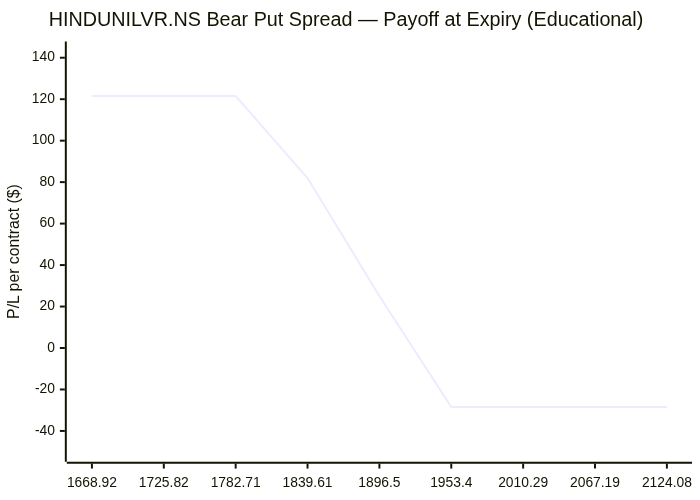
HINDUNILVR.NS: Bear Put Spread
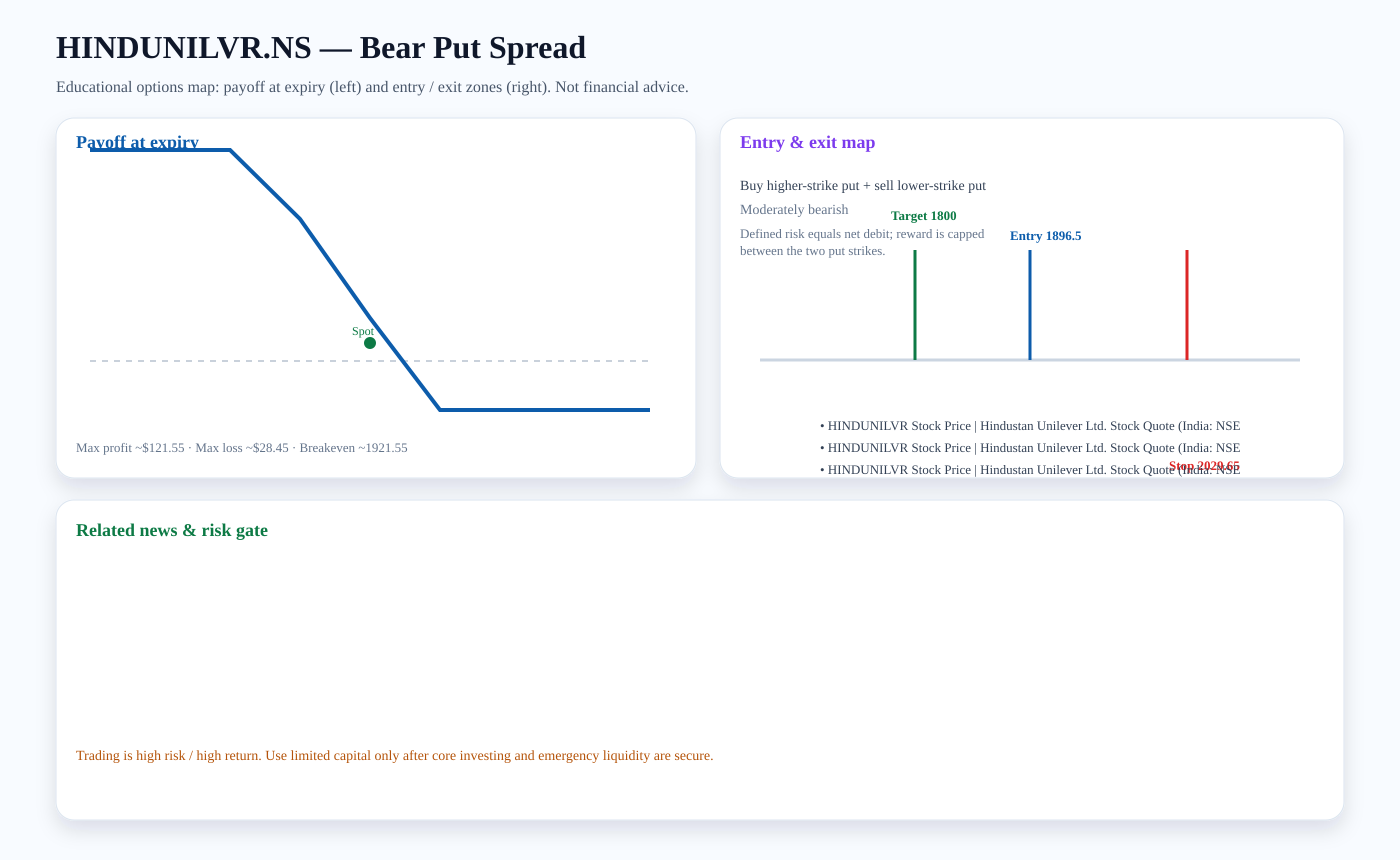
Structure: Buy higher-strike put + sell lower-strike put
Outlook: Moderately bearish
Entry zone: ~1896.5 · Target: ~1800 · Stop: ~2029.65 · Breakeven: ~1921.55
Risk note: Defined risk equals net debit; reward is capped between the two put strikes.
Related news links:
Payoff chart (Mermaid):
Entry / exit map (Mermaid):

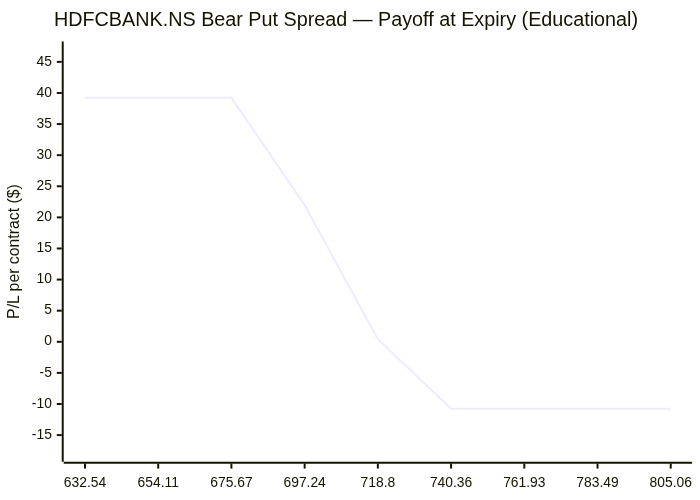
HDFCBANK.NS: Bear Put Spread
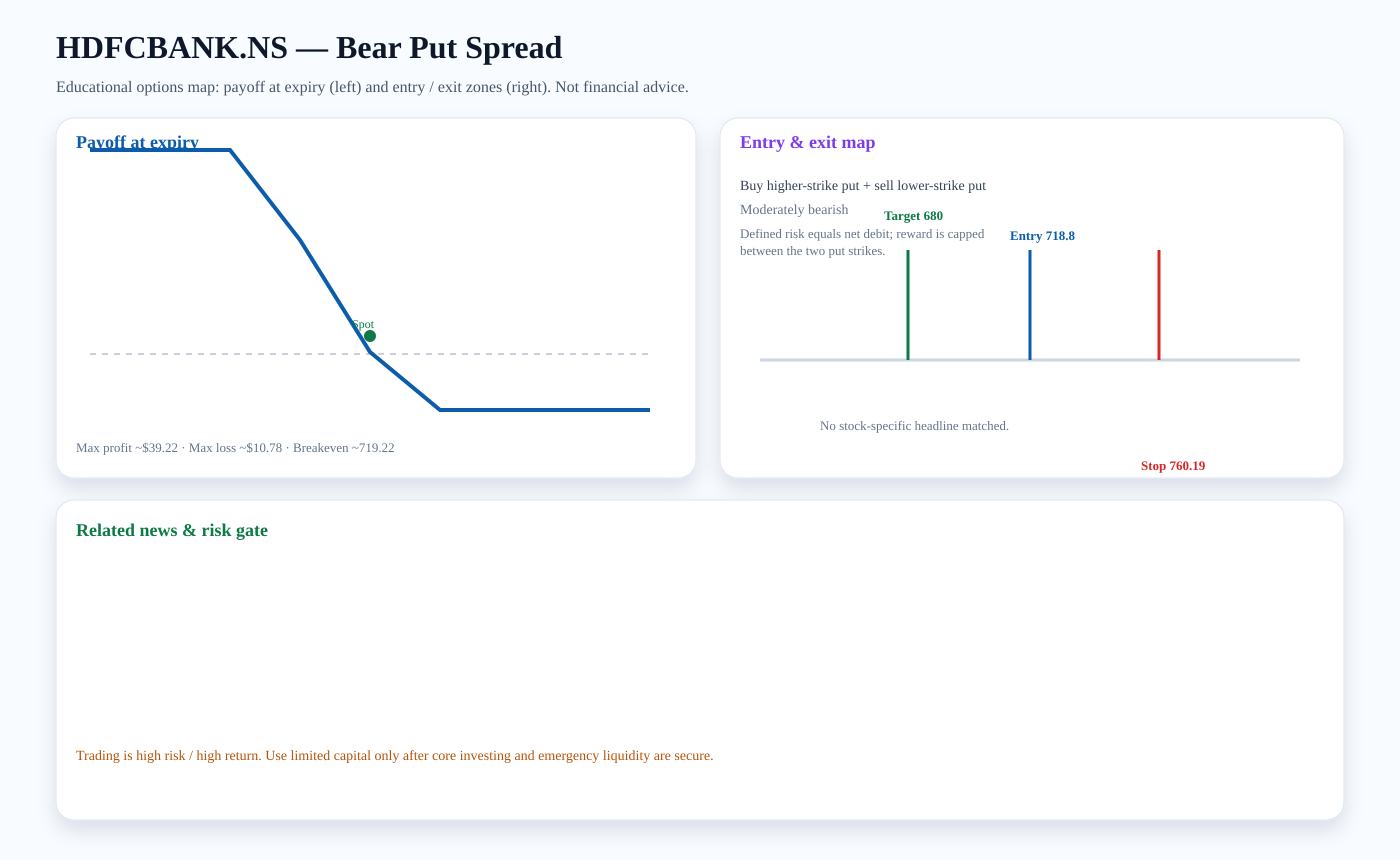
Structure: Buy higher-strike put + sell lower-strike put
Outlook: Moderately bearish
Entry zone: ~718.8 · Target: ~680 · Stop: ~760.19 · Breakeven: ~719.22
Risk note: Defined risk equals net debit; reward is capped between the two put strikes.
Payoff chart (Mermaid):
Entry / exit map (Mermaid):

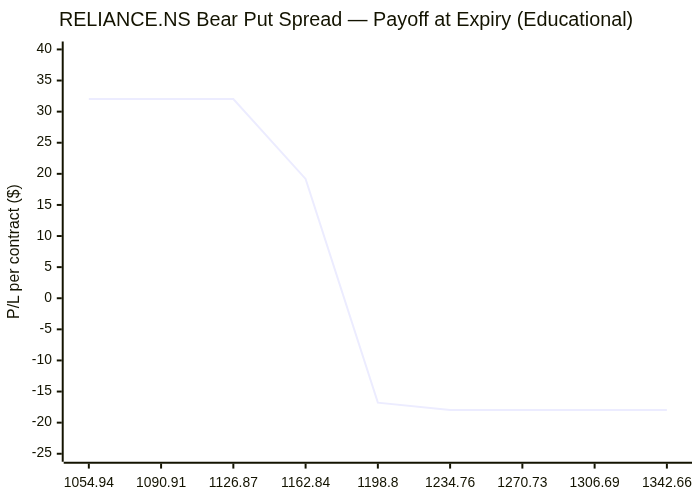
RELIANCE.NS: Bear Put Spread
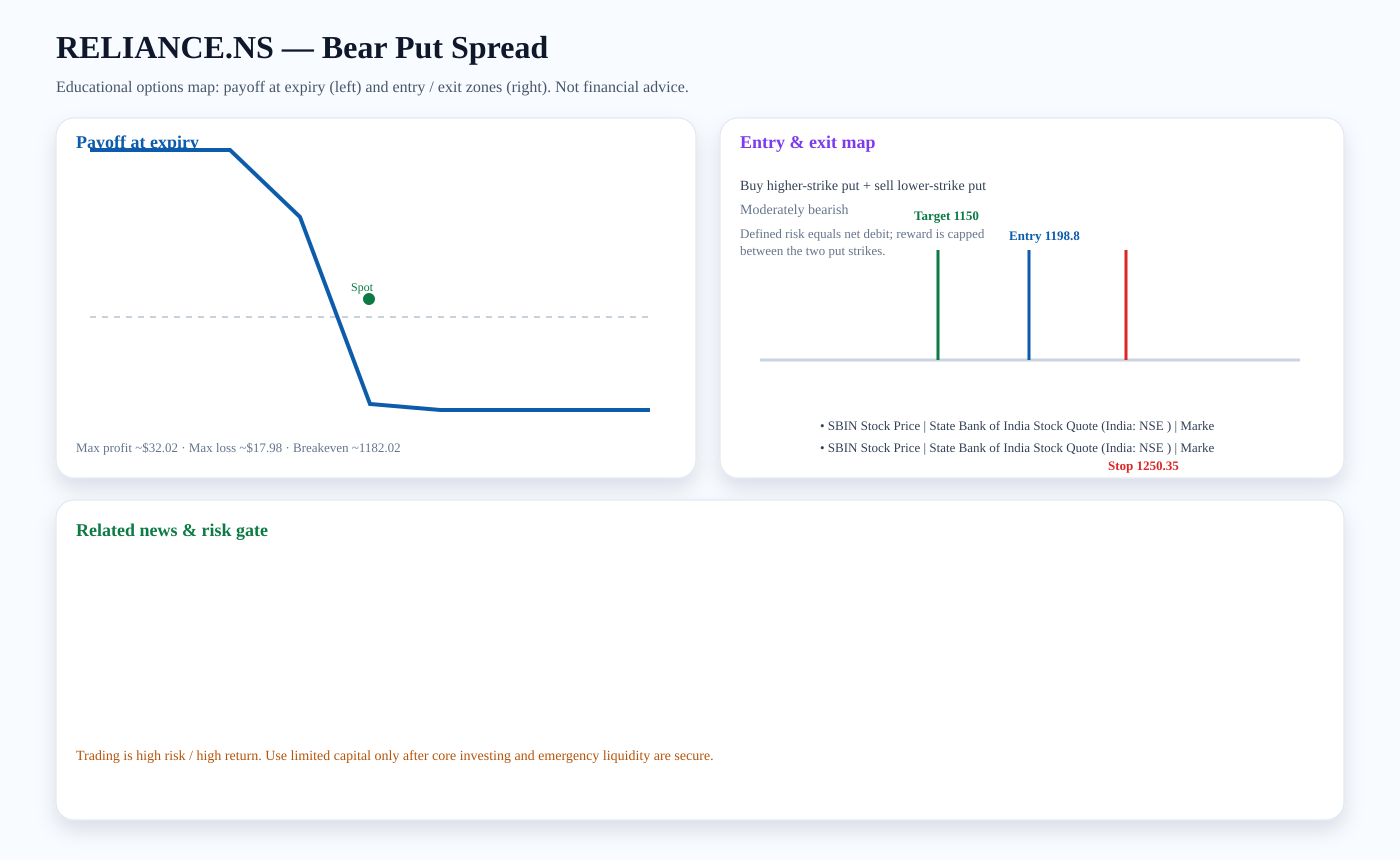
Structure: Buy higher-strike put + sell lower-strike put
Outlook: Moderately bearish
Entry zone: ~1198.8 · Target: ~1150 · Stop: ~1250.35 · Breakeven: ~1182.02
Risk note: Defined risk equals net debit; reward is capped between the two put strikes.
Related news links:
Payoff chart (Mermaid):
Entry / exit map (Mermaid):

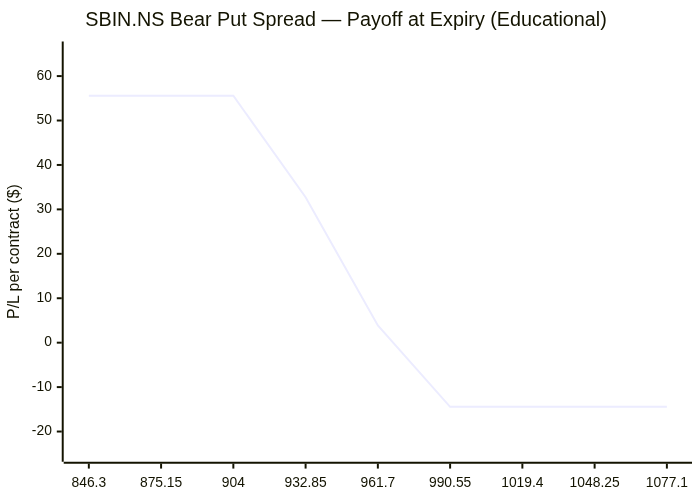
SBIN.NS: Bear Put Spread
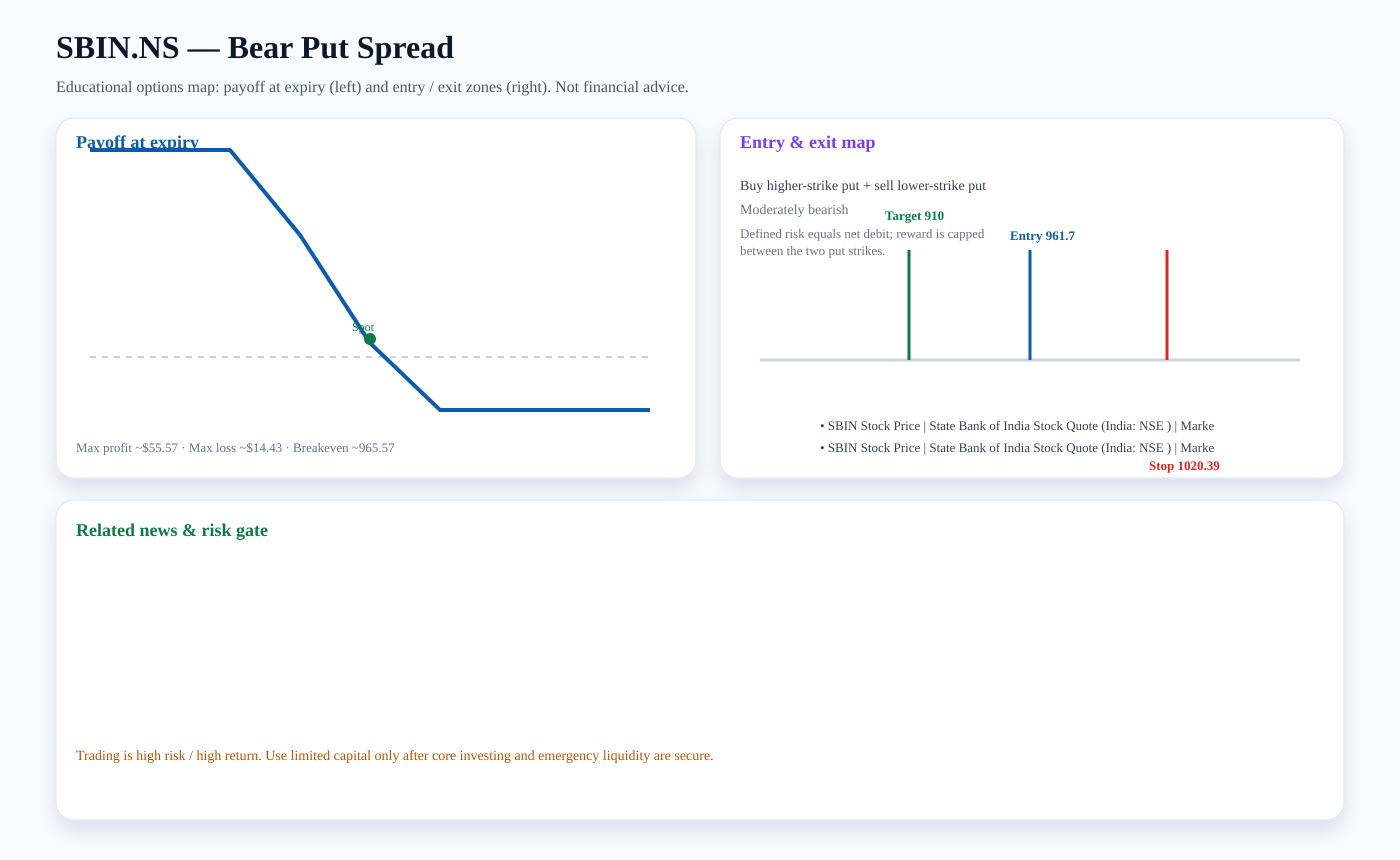
Structure: Buy higher-strike put + sell lower-strike put
Outlook: Moderately bearish
Entry zone: ~961.7 · Target: ~910 · Stop: ~1020.39 · Breakeven: ~965.57
Risk note: Defined risk equals net debit; reward is capped between the two put strikes.
Related news links:
Payoff chart (Mermaid):
Entry / exit map (Mermaid):

Trading versus investing
Investing focuses on durable ownership, diversification, and compounding. Trading seeks faster tactical returns and carries higher risk. We treat options trading as limited-capital, educational analysis only after core investment capital and emergency liquidity are protected.
PDF report — Premium
Premium members get the full PDF attached to email briefs and can download it here. Upgrade for just $2 a month.
Subscribe for $2/month