
US Market Intelligence Brief
Report as-of (US/Eastern): 2026-07-01 09:04:47 EDT
Executive summary
Report as-of (US/Eastern): 2026-07-01 09:04:47 EDT
The US market is showing mixed signals as we enter Q3 2026, with chipmakers leading gains while established names face headwinds. Bloom Energy (BE) dominates pre-market action with a +12.7% surge on a massive $25B AI infrastructure partnership expansion with Brookfield. Tech giants Salesforce (CRM) and ServiceNow (NOW) are rebounding +3.2% and +4.2% respectively, potentially finding support after recent monthly declines of -17.8% and -20.2%. However, Nike (NKE) continues its descent (-2.3% pre-market) amid a brutal -10.4% monthly slide, while Circle Internet (CRCL) plunges -16% as crypto infrastructure faces ongoing pressure.
The semiconductor rally mentioned in headlines (VanEck SMH +3%, +82% YTD) suggests AI infrastructure demand remains robust, supporting BE's breakout momentum.
Market regime check
Based on available headlines, the S&P 500 and Nasdaq closed higher with the Dow posting its best first half in five years. The VanEck Semiconductor ETF (SMH) climbed 3% and sits at +82% year-to-date, indicating a strong AI/chip infrastructure bull market remains intact.
Key regime indicators:
- Semiconductors leading: SMH's 82% YTD gain suggests AI infrastructure spending cycle continues
- Broad market resilience: Dow's best H1 in 5 years indicates underlying economic strength
- Sector rotation active: Tech rebounding while consumer discretionary (NKE) struggles
The market appears to be in a selective growth regime favoring AI infrastructure plays while punishing traditional consumer brands facing margin pressure.
Why these names are trending
Search momentum drivers:
- BE: Brookfield partnership expansion creating massive buzz around AI power infrastructure
- CRM/NOW: Oversold bounce candidates after steep monthly declines (-17.8%/-20.2%)
- NKE: Negative momentum accelerating (-10.4% monthly) drawing attention to consumer weakness
- CRCL: Crypto infrastructure selloff continuing (-44.6% monthly) amid regulatory uncertainty
Price action context:
- BE: Breaking out of weekly consolidation (-5.99% 1W) on fundamental catalyst
- Tech rebounds: CRM/NOW showing weekly strength (+2.1%/+3.5%) after oversold conditions
- Defensive weakness: GIS flat despite consumer staple status, suggesting rotation away from defensives
Key news drivers
- AI Infrastructure Boom: Brookfield-Bloom Energy partnership expansion to $25B (5x increase) validates massive power infrastructure needs for AI data centers
- Semiconductor Strength: VanEck SMH +3% with 82% YTD gains indicates chip demand cycle remains robust, supporting AI infrastructure thesis
- Global AI Competition: Headlines about China's supercomputer advances and Anthropic model restrictions suggest geopolitical AI race intensifying, potentially benefiting US infrastructure providers
- Tech Oversold Bounce: CRM/NOW financial analysis shows current levels near 2-year lows, creating technical rebound opportunity
Durable momentum ideas
Primary momentum play: Bloom Energy (BE)
- Catalyst durability: $25B partnership provides multi-year revenue visibility in high-growth AI power market
- Sector tailwinds: SMH's 82% YTD performance validates AI infrastructure investment cycle
- Technical setup: Breaking above recent consolidation with massive volume (11.3M vs normal)
Secondary rebound plays: CRM/NOW
- Oversold positioning: Both near 2-year lows after -17.8%/-20.2% monthly declines
- Sector rotation: Tech showing signs of stabilization as defensive sectors weaken
- Fundamental support: Enterprise software demand remains resilient in AI adoption cycle
Momentum sustainability factors:
- AI infrastructure spending cycle appears multi-year in nature
- Power/energy infrastructure has long lead times, supporting BE's pipeline visibility
- Enterprise tech oversold conditions creating technical bounce potential
Options / structure ideas
*This is educational analysis and not financial advice. Verify current bid/ask spreads and liquidity before trading.*
BE (Primary: CALL)
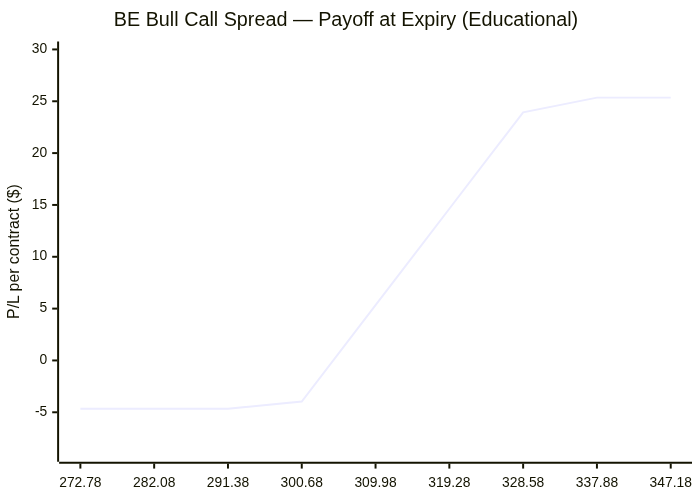
- Call structure: 310C/320C debit spread (July 10) – captures continued momentum on partnership news
- Put structure: 290P cash-secured puts for pullback entry only
- Rationale: Major fundamental catalyst with multi-year implications
CRM (Primary: CALL)
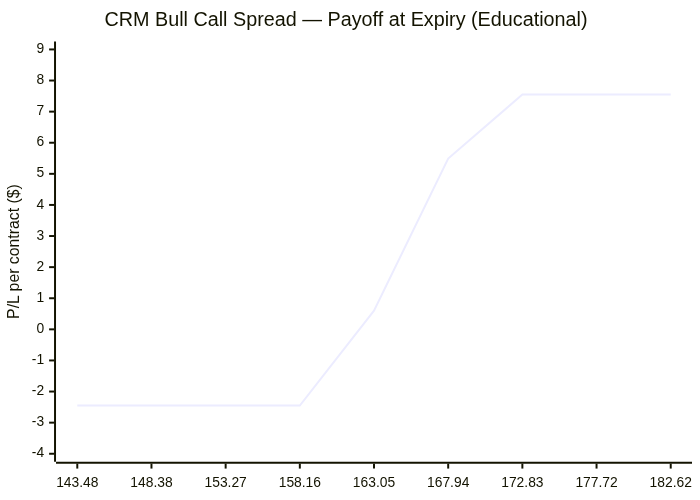
- Call structure: 162.5C/167.5C debit spread (July 10) – oversold bounce play
- Put structure: 155P cash-secured puts if willing to own at discount
- Rationale: Technical rebound from 2-year low levels
NOW (Primary: CALL)
- Call structure: 104C/107C debit spread (July 10) – gap-up continuation
- Put structure: 100P protective puts for existing longs
- Rationale: Pre-market strength suggests momentum shift
NKE (Primary: PUT)
- Put structure: 40.5P/38P debit spread (July 10) – trend continuation
- Call structure: Covered calls if holding shares
- Rationale: Monthly downtrend intact, consumer discretionary weakness
CRCL (Primary: PUT)
- Put structure: 64P/60P debit spread (July 10) – continued crypto weakness
- Call structure: Short-term credit spreads on any bounce
- Rationale: Severe downtrend (-44.6% monthly) likely continues
Risks & watch-outs
Immediate risks:
- Options liquidity concerns: Multiple names showing $0.00 bid/ask spreads, suggesting stale quotes or poor liquidity
- Gap fade risk: Pre-market moves may not hold through regular session
- Earnings calendar: Unknown earnings dates could create unexpected volatility
Structural risks:
- AI bubble concerns: 82% YTD gains in semiconductors suggest potential overextension
- Consumer weakness spreading: NKE's decline may signal broader discretionary spending pressure
- Crypto regulatory overhang: CRCL's weakness reflects ongoing uncertainty in digital asset infrastructure
Macro watch-outs:
- Interest rate sensitivity: Tech rebounds vulnerable to rate policy shifts
- Geopolitical AI tensions: Export controls and China competition could impact sector dynamics
- Q3 earnings expectations: Recent oversold conditions may reflect lowered guidance expectations
Key levels to monitor:
- BE: Hold above $300 for momentum continuation
- CRM/NOW: Need to reclaim weekly highs for sustained bounce
- NKE: Break below $40 could accelerate decline
- SMH: Watch for any reversal in semiconductor leadership
Visual strategy maps
Payoff curves and entry/exit zones below are educational aids — not trade instructions. Confirm with your own chart, liquidity, and risk limits.
CRCL: Bear Put Spread
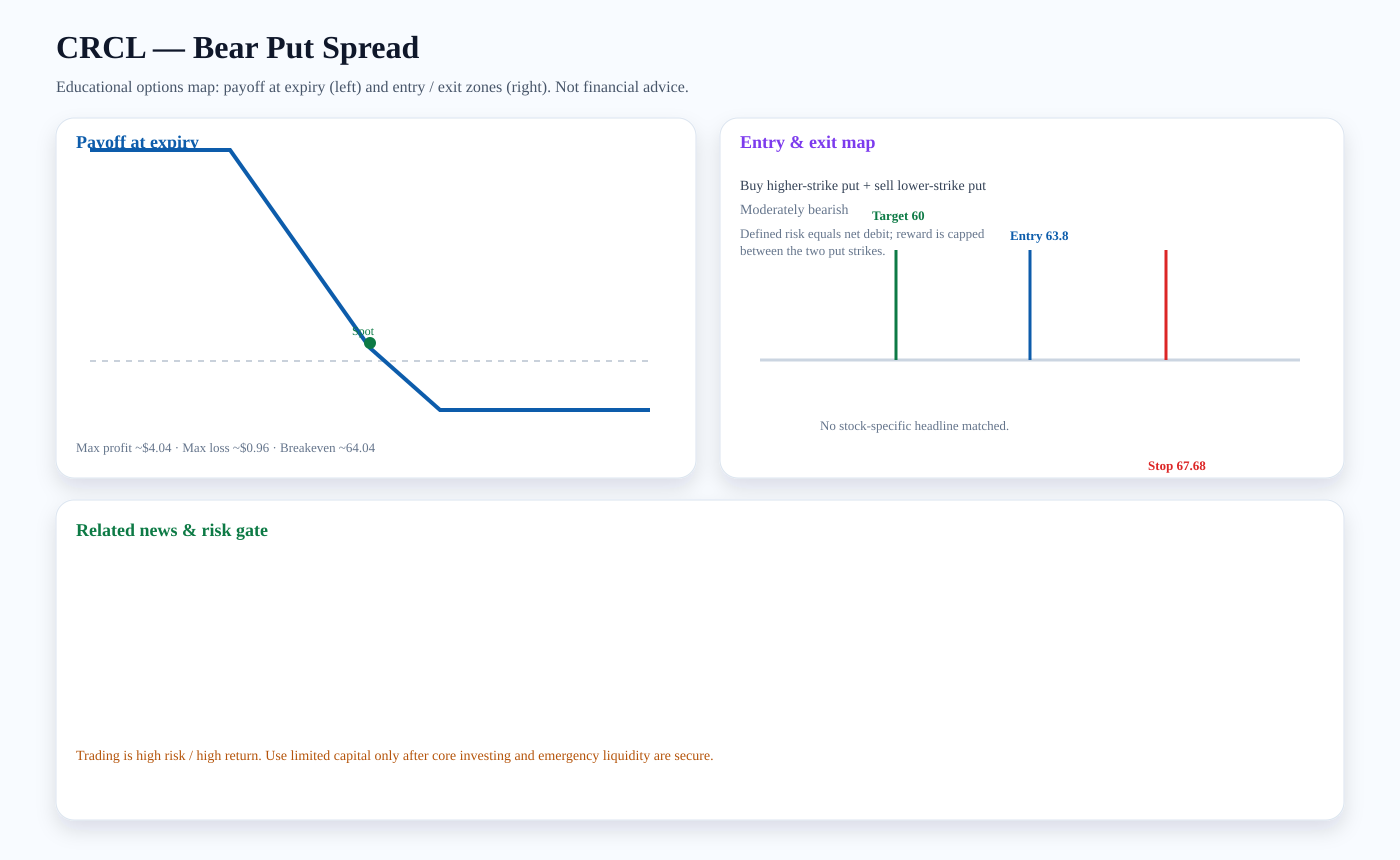
Structure: Buy higher-strike put + sell lower-strike put
Outlook: Moderately bearish
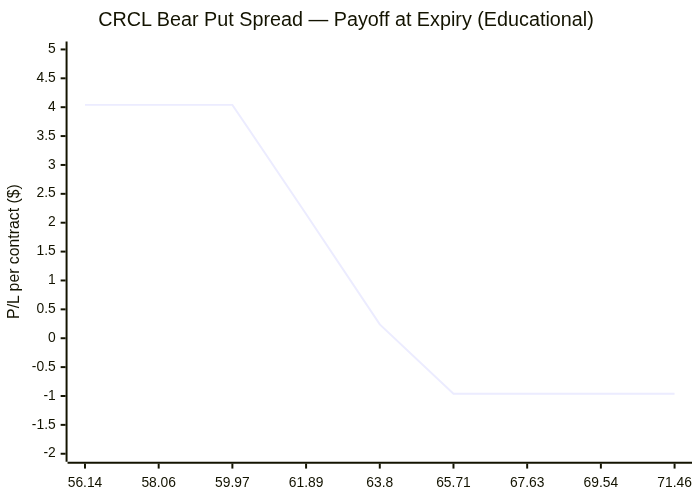
Entry zone: ~63.8 · Target: ~60 · Stop: ~67.68 · Breakeven: ~64.04
Risk note: Defined risk equals net debit; reward is capped between the two put strikes.
Payoff chart (Mermaid):
Entry / exit map (Mermaid):

NOW: Bull Call Spread
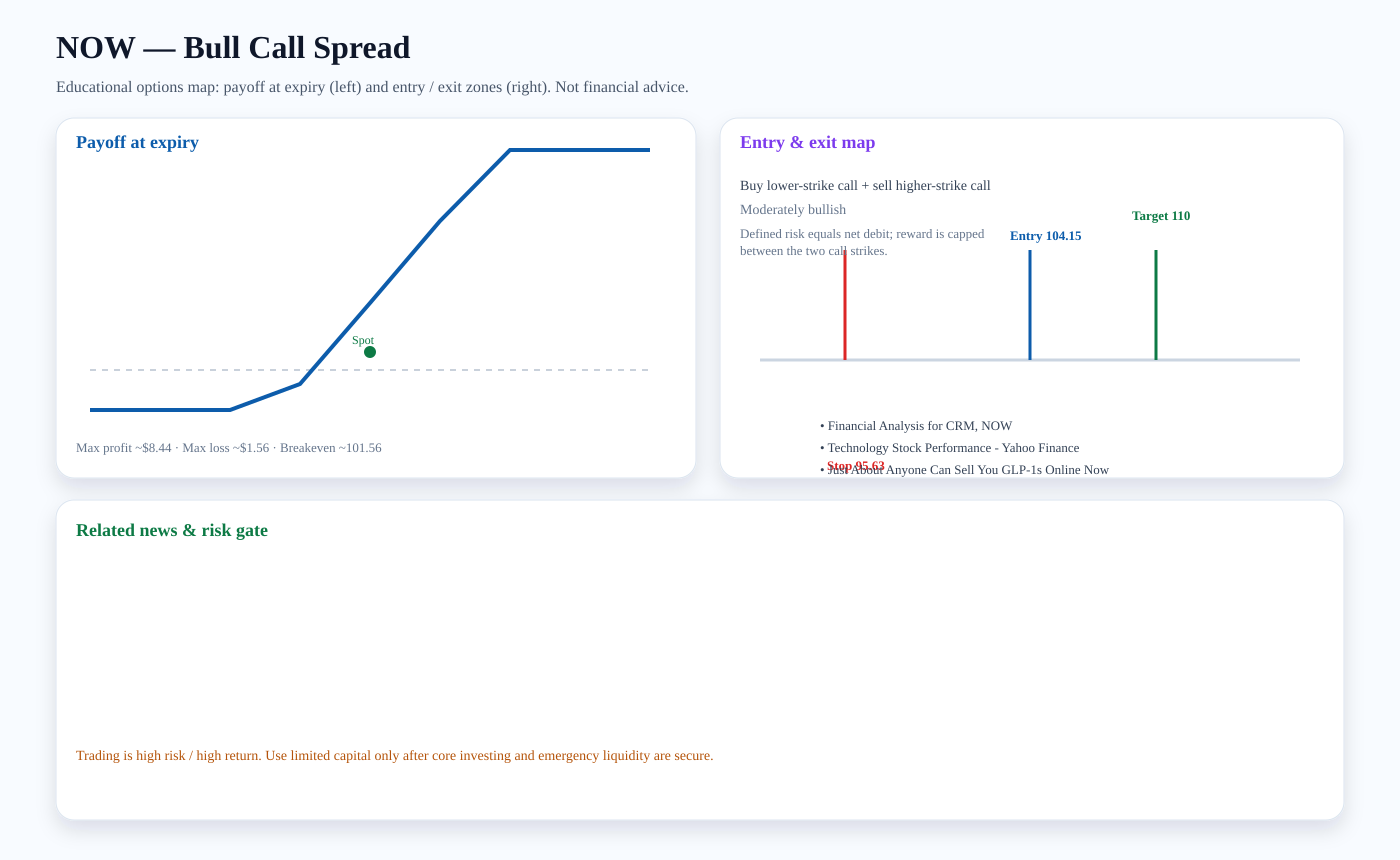
Structure: Buy lower-strike call + sell higher-strike call
Outlook: Moderately bullish
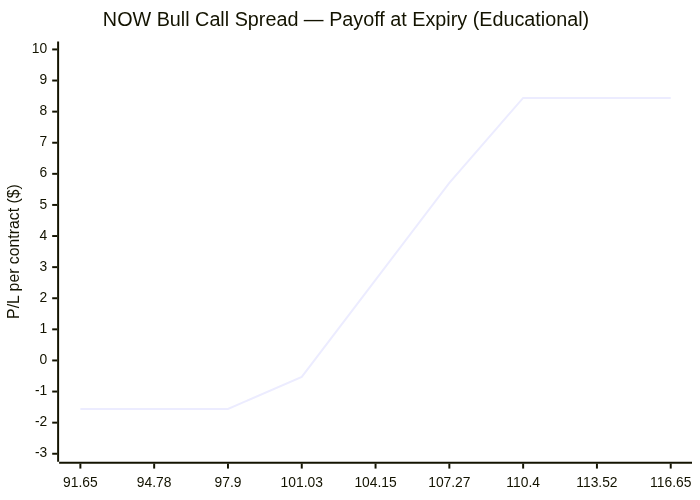
Entry zone: ~104.15 · Target: ~110 · Stop: ~95.63 · Breakeven: ~101.56
Risk note: Defined risk equals net debit; reward is capped between the two call strikes.
Related news links:
Payoff chart (Mermaid):
Entry / exit map (Mermaid):

CRM: Bull Call Spread
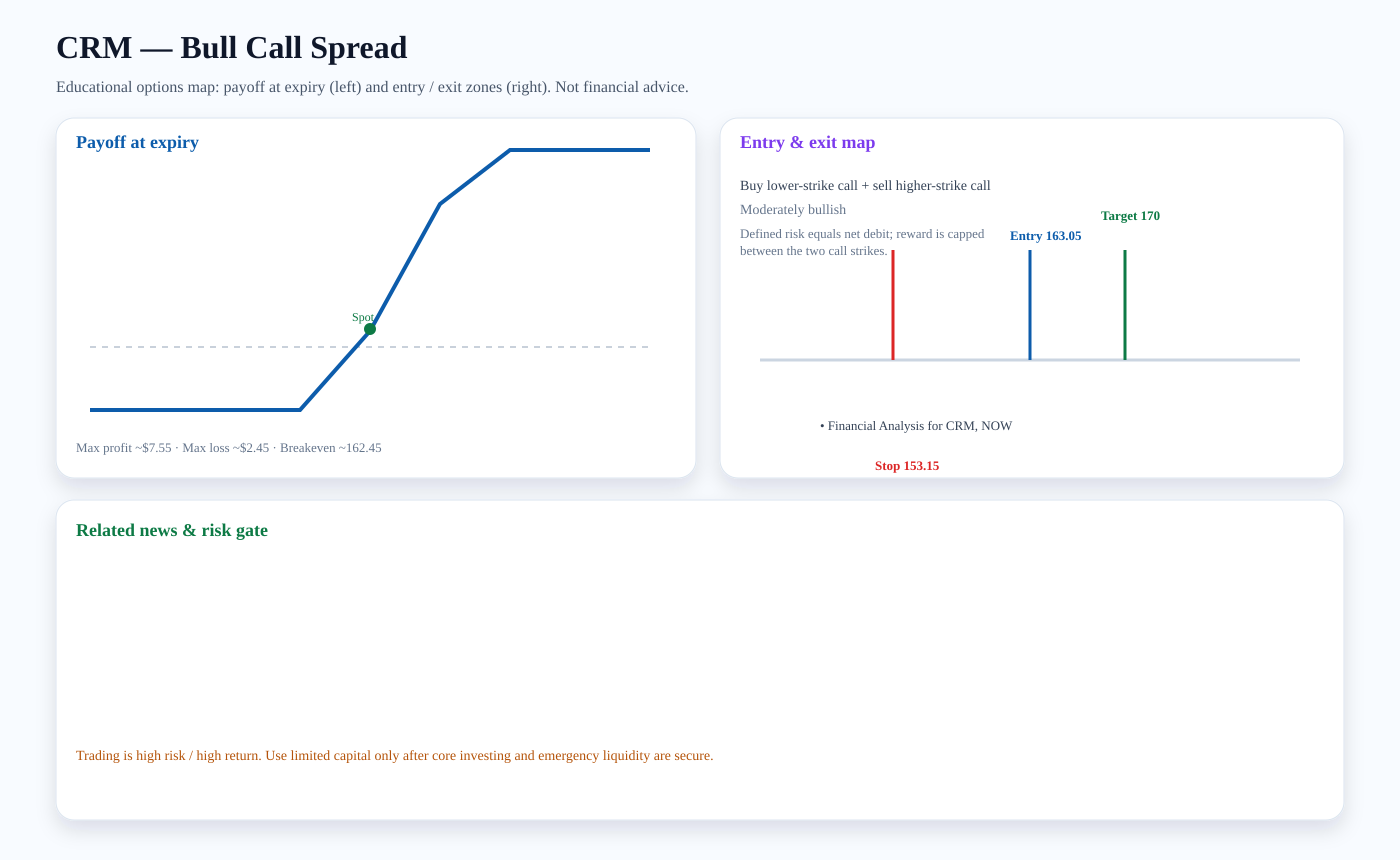
Structure: Buy lower-strike call + sell higher-strike call
Outlook: Moderately bullish
Entry zone: ~163.05 · Target: ~170 · Stop: ~153.15 · Breakeven: ~162.45
Risk note: Defined risk equals net debit; reward is capped between the two call strikes.
Related news links:
Payoff chart (Mermaid):
Entry / exit map (Mermaid):

BE: Bull Call Spread
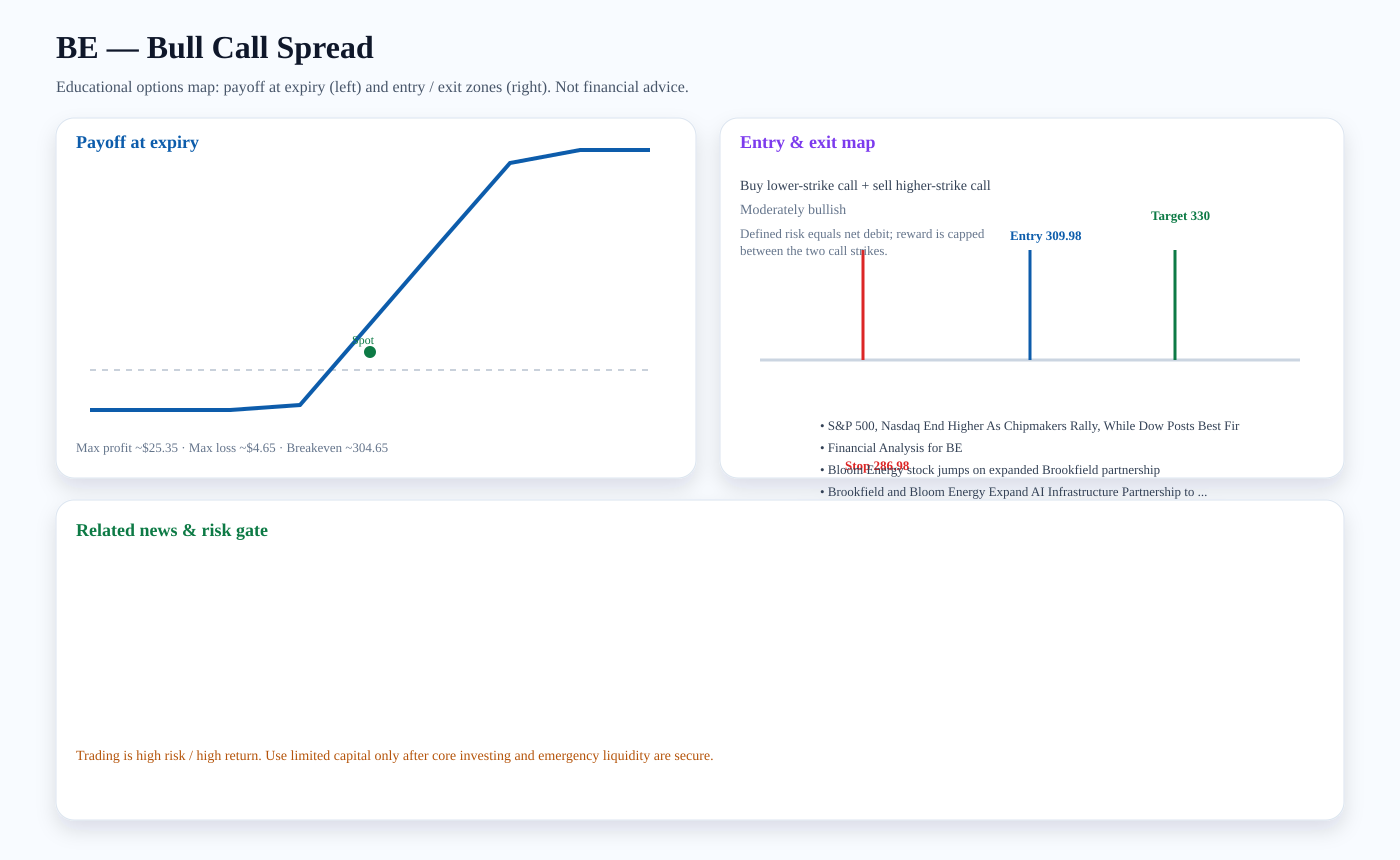
Structure: Buy lower-strike call + sell higher-strike call
Outlook: Moderately bullish
Entry zone: ~309.98 · Target: ~330 · Stop: ~286.98 · Breakeven: ~304.65
Risk note: Defined risk equals net debit; reward is capped between the two call strikes.
Related news links:
Payoff chart (Mermaid):
Entry / exit map (Mermaid):

Trading versus investing
Investing focuses on durable ownership, diversification, and compounding. Trading seeks faster tactical returns and carries higher risk. We treat options trading as limited-capital, educational analysis only after core investment capital and emergency liquidity are protected.
PDF report — Premium
Premium members get the full PDF attached to email briefs and can download it here. Upgrade for just $2 a month.
Subscribe for $2/month