
US Market Intelligence Brief
Report as-of (US/Eastern): 2026-07-02 09:31:59 EDT
Executive summary
Report as-of (US/Eastern): 2026-07-02 09:31:59 EDT
The US market is showing strong momentum in select growth names today, led by Robinhood (+7.03%) and MicroStrategy (+8.00%) breaking key technical levels. Reddit (-2.53%) and Rivian (+5.94%) round out the trending names, all exhibiting exceptional weekly performance (+18-24%). This appears to be a momentum-driven session with retail/fintech and Bitcoin-proxy names leading, while EV and social media stocks show mixed action. Volume patterns suggest institutional participation, though options liquidity appears constrained across trending names.
Market regime check (S&P 500 + sector/thematic ETFs)
Sector Context: No major ETF data captured in today's snapshot, limiting broader market regime assessment. However, the trending names suggest:
- Fintech/Retail Trading: HOOD's +7% surge indicates renewed retail trading interest
- Crypto Proxy: MSTR's +8% move suggests Bitcoin-related momentum despite recent volatility
- Growth/Momentum: Strong weekly trends across all names (+18-24%) indicate growth rotation
Regime Implications: The concentration in high-beta, retail-favored names suggests a risk-on environment with momentum-chasing behavior, though limited to specific pockets rather than broad market strength.
Why these names are trending (search momentum + weekly/monthly price action)
HOOD: Explosive momentum with +24.41% weekly and +31.91% monthly gains, breaking above $116 psychological resistance. Search interest driven by options activity and retail trading volume surge.
MSTR: +18.13% weekly despite -25.93% monthly volatility, reflecting Bitcoin correlation. Trending due to crypto market positioning and treasury strategy discussions.
RDDT: Strong underlying trend (+21.77% weekly, +13.77% monthly) despite today's -2.53% pullback. Sustained social media platform growth driving institutional interest.
RIVN: +22.61% weekly momentum (+5.38% monthly) with today's +5.94% continuation. EV sector rotation and potential production/delivery catalysts driving search volume.
Key news drivers
Primary Catalysts:
- HOOD appearing in "Top Trending Stocks" across multiple Yahoo Finance headlines, indicating sustained retail interest
- MSTR facing Bitcoin volatility challenges per news headlines, yet stock showing resilience with +8% gains
- Options activity surge in both HOOD and MSTR with July 2026 expiry contracts trending
- Tesla battery theft headlines potentially benefiting RIVN as alternative EV play
Broader Context: Limited macro news in capture, suggesting stock-specific momentum rather than sector-wide catalysts driving today's action.
Durable momentum ideas (mid/high-cap focus)
HOOD (Primary Pick):
- Sustainability: Fintech beneficiary of renewed retail trading activity, strong fundamental backdrop
- Technical: Clean breakout above $116 with volume confirmation (3.1M vs average)
- Catalyst Path: Potential earnings beat, crypto trading revenue, platform expansion
MSTR (Secondary):
- Sustainability: Bitcoin treasury strategy provides leveraged crypto exposure for institutions
- Technical: Recovering from monthly lows, +18% weekly suggests trend reversal
- Catalyst Path: Bitcoin price recovery, treasury additions, enterprise software growth
RIVN (Speculative):
- Sustainability: EV sector rotation, potential production ramp catalysts
- Technical: Strong weekly momentum but lower conviction given sector volatility
- Risk: Higher beta, execution risk, competitive EV landscape
Options / structure ideas
*This is educational analysis, not financial advice.*
HOOD (Primary: CALL)
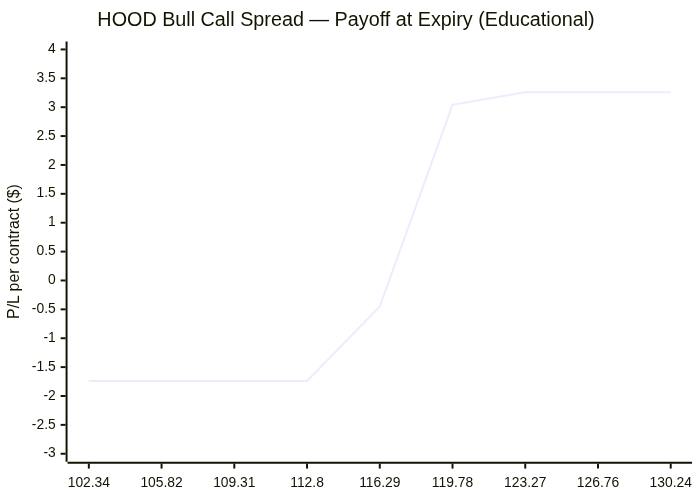
- Call Structure: Buy 116C / Sell 120C debit spread (July 10th expiry) targeting momentum continuation
- Put Structure: Cash-secured 110P for pullback entry (lower conviction given momentum)
- Rationale: ATM positioning with defined upside, 8-day tenor captures near-term momentum
MSTR (Primary: CALL)
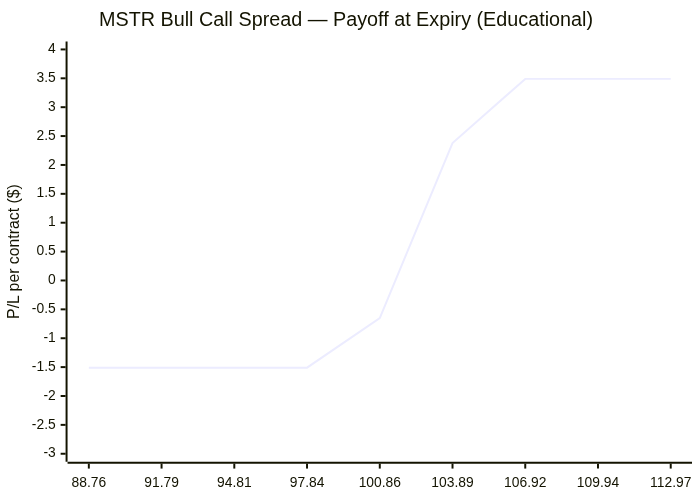
- Call Structure: Buy 101C / Sell 105C debit spread (July 10th) on Bitcoin proxy momentum
- Put Structure: Protective 95P for existing longs given crypto correlation risk
- Rationale: Short-term momentum play while limiting Bitcoin volatility exposure
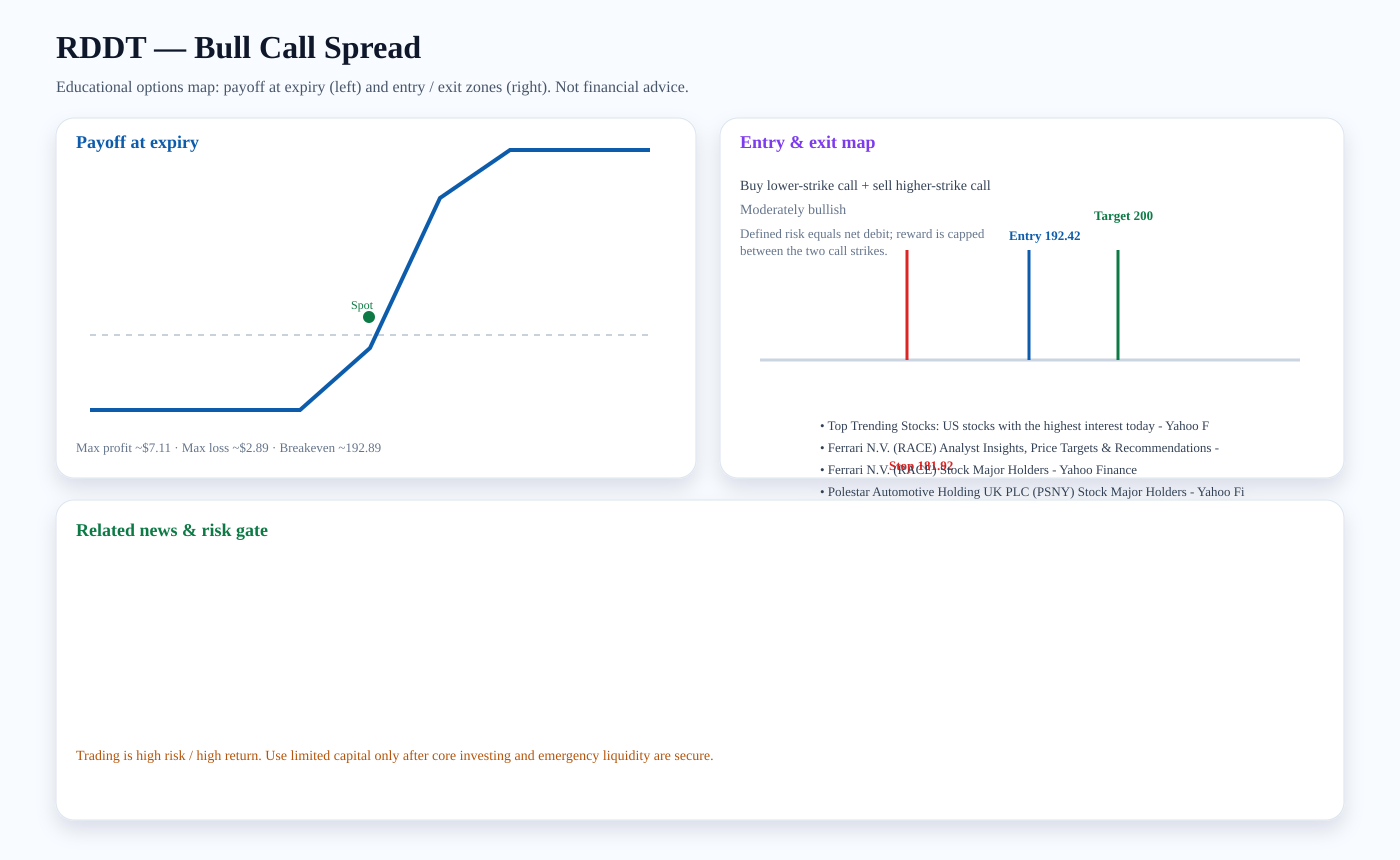
RDDT (Primary: CALL)
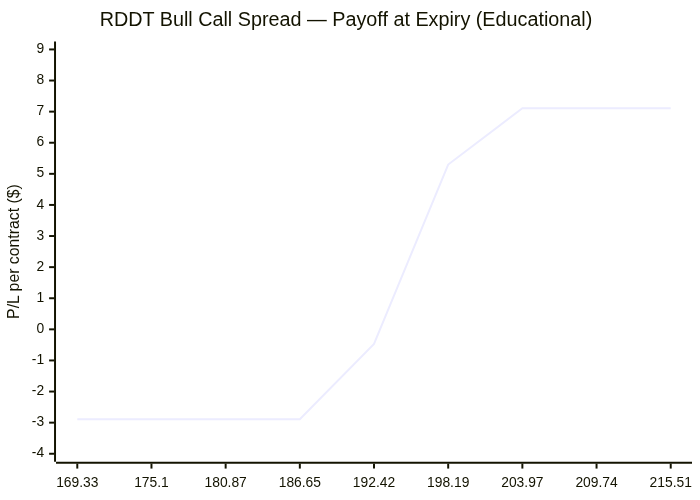
- Call Structure: Buy 192.5C / Sell 200C spread targeting bounce from pullback
- Put Structure: Cash-secured 185P if seeking dip entry
- Rationale: Strong underlying trend suggests today's weakness is buyable
Critical Liquidity Warning: All trending names show $0.00 bid/ask spreads in options data, indicating stale quotes or poor liquidity. Verify live spreads before any options trades.
Risks & watch-outs
Immediate Risks:
- Options Liquidity: Zero bid/ask spreads across all trending names suggest execution challenges
- Momentum Reversal: Strong weekly gains (+18-24%) create profit-taking vulnerability
- Concentration Risk: Trending names represent narrow market leadership
Structural Concerns:
- Bitcoin Correlation: MSTR exposed to crypto volatility beyond company fundamentals
- Retail Dependence: HOOD vulnerable to trading volume cycles and market sentiment shifts
- Execution Risk: RIVN faces EV sector competition and production scaling challenges
Timing Risks:
- July 10th Expiry: 8-day options window provides limited time for thesis to play out
- Gap Risk: High-beta names susceptible to overnight volatility on news/crypto moves
- Earnings Calendar: Unknown earnings dates create potential catalyst/volatility risk
Key Levels to Watch: HOOD $116 support, MSTR $100 psychological level, RDDT $190 bounce zone, RIVN $18 breakout level.
Visual strategy maps
Payoff curves and entry/exit zones below are educational aids — not trade instructions. Confirm with your own chart, liquidity, and risk limits.
HOOD: Bull Call Spread
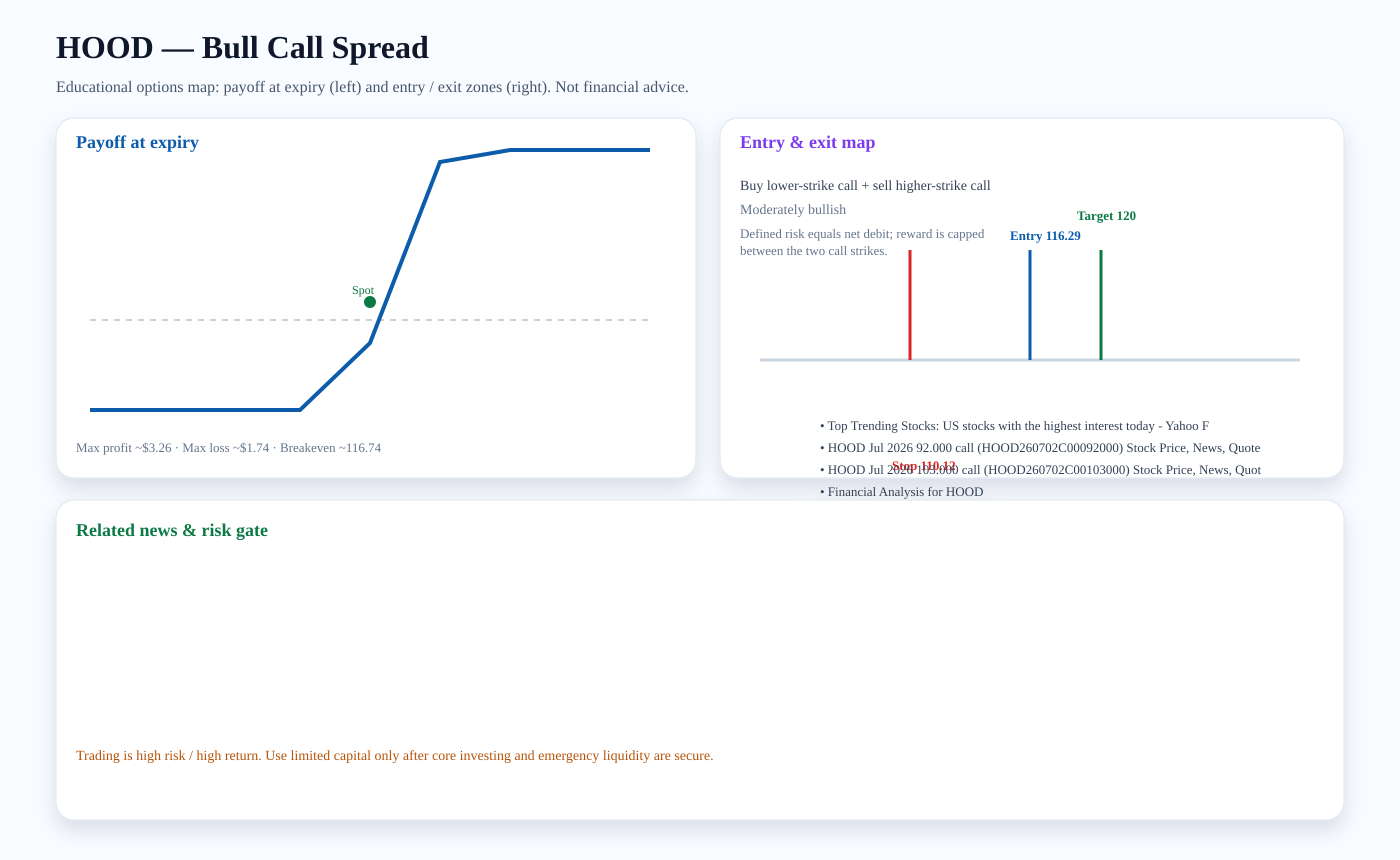
Structure: Buy lower-strike call + sell higher-strike call
Outlook: Moderately bullish
Entry zone: ~116.29 · Target: ~120 · Stop: ~110.12 · Breakeven: ~116.74
Risk note: Defined risk equals net debit; reward is capped between the two call strikes.
Related news links:
Payoff chart (Mermaid):
Entry / exit map (Mermaid):

MSTR: Bull Call Spread
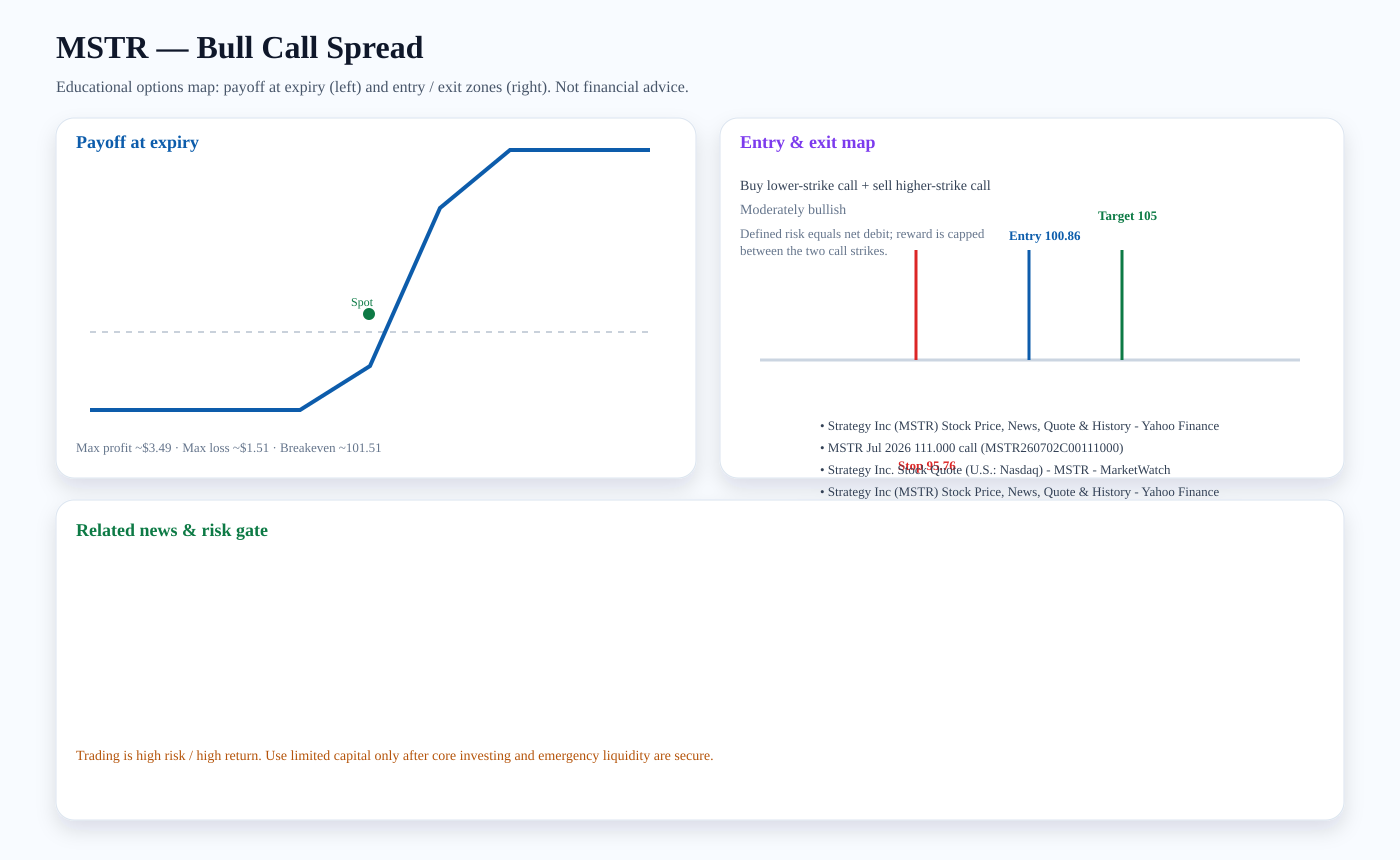
Structure: Buy lower-strike call + sell higher-strike call
Outlook: Moderately bullish
Entry zone: ~100.86 · Target: ~105 · Stop: ~95.76 · Breakeven: ~101.51
Risk note: Defined risk equals net debit; reward is capped between the two call strikes.
Related news links:
Payoff chart (Mermaid):
Entry / exit map (Mermaid):

RDDT: Bull Call Spread
Structure: Buy lower-strike call + sell higher-strike call
Outlook: Moderately bullish
Entry zone: ~192.42 · Target: ~200 · Stop: ~181.92 · Breakeven: ~192.89
Risk note: Defined risk equals net debit; reward is capped between the two call strikes.
Related news links:
Payoff chart (Mermaid):
Entry / exit map (Mermaid):

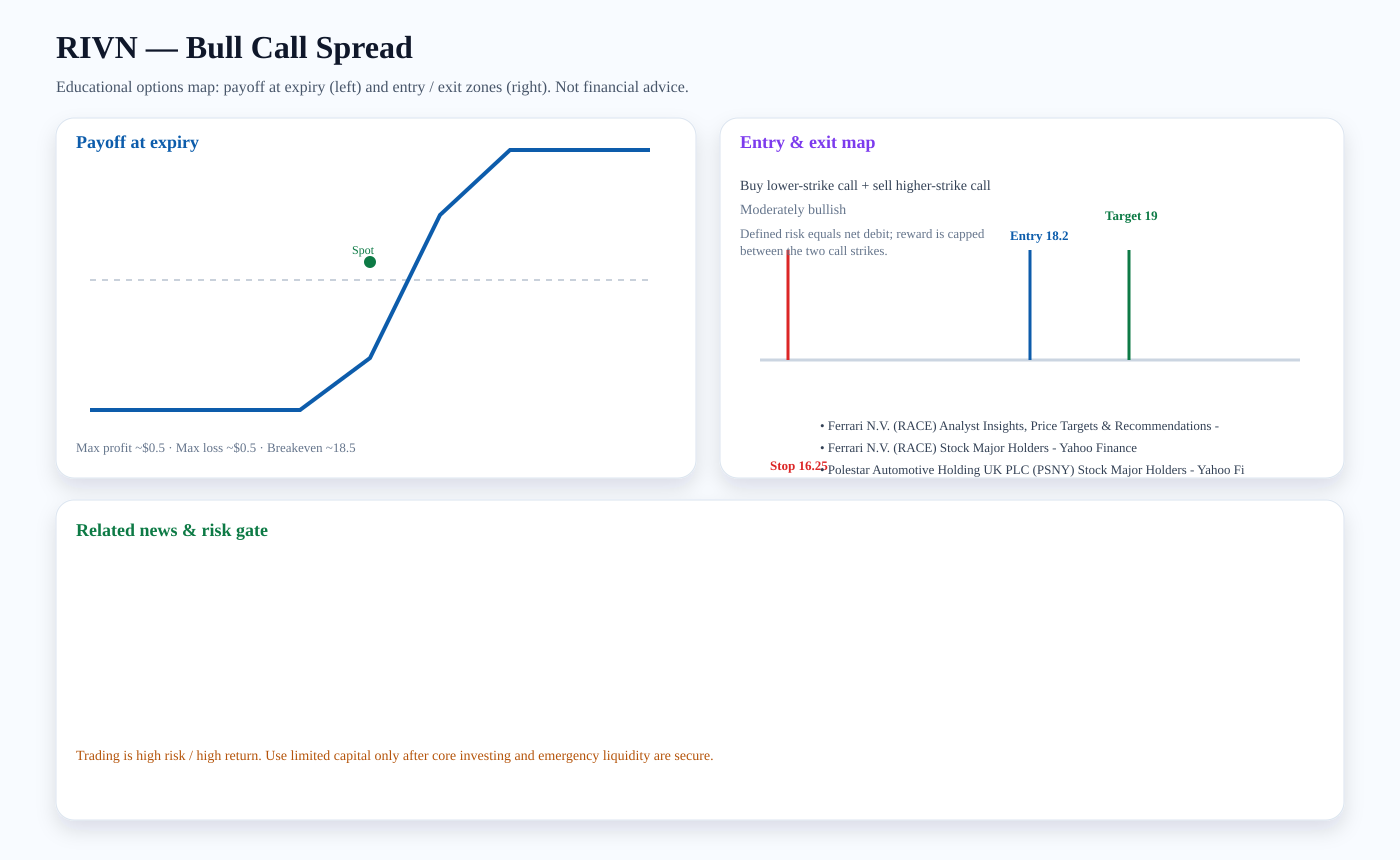
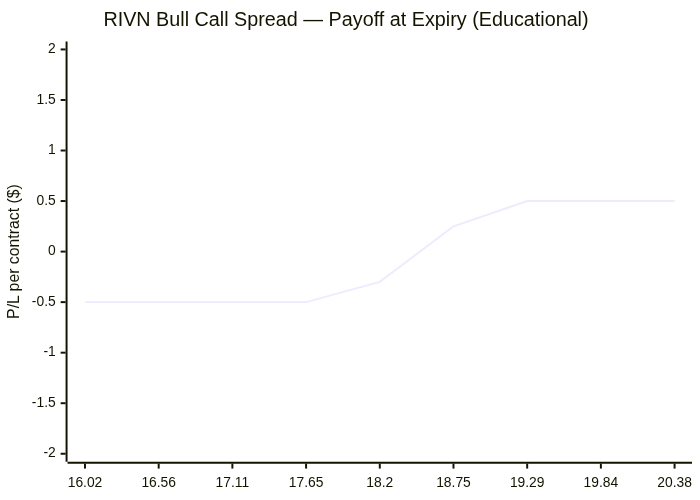
RIVN: Bull Call Spread
Structure: Buy lower-strike call + sell higher-strike call
Outlook: Moderately bullish
Entry zone: ~18.2 · Target: ~19 · Stop: ~16.25 · Breakeven: ~18.5
Risk note: Defined risk equals net debit; reward is capped between the two call strikes.
Related news links:
Payoff chart (Mermaid):
Entry / exit map (Mermaid):

Trading versus investing
Investing focuses on durable ownership, diversification, and compounding. Trading seeks faster tactical returns and carries higher risk. We treat options trading as limited-capital, educational analysis only after core investment capital and emergency liquidity are protected.
PDF report — Premium
Premium members get the full PDF attached to email briefs and can download it here. Upgrade for just $2 a month.
Subscribe for $2/month