
US Market Intelligence Brief
Report as-of (US/Eastern): 2026-07-08 09:55:21 EDT
Executive summary
Report as-of (US/Eastern): 2026-07-08 09:55:21 EDT
The US market is experiencing a bifurcated session with energy stocks rallying on crude oil strength while AI/semiconductor concerns weigh on broader sentiment. BABA leads trending names with a massive +9.66% gap-up on pre-earnings optimism, while energy majors XOM, CVX, and OXY benefit from geopolitical oil premium. The session reflects rotation into value/energy amid AI sector jitters following Samsung results and DeepSeek chip development reports.
Key themes: Energy sector outperformance, BABA earnings anticipation, AI/semiconductor volatility, and potential sector rotation from growth to value plays.
Market regime check (S&P 500 + sector/thematic ETFs)
Market showing mixed regime signals with sector-specific divergence:
- Energy sector strength: XOM (+3.32% weekly), CVX (+6.04% weekly), OXY (+8.8% weekly) all showing strong weekly momentum despite monthly headwinds
- AI/Semiconductor pressure: News flow suggests renewed concerns about AI chip competition and Korean semiconductor weakness extending to broader tech
- Crude oil catalyst: Reports indicate >5% crude surge driving energy outperformance
- Rotation dynamics: Traditional energy benefiting while growth/AI names face headwinds
Regime assessment: Transitional period with defensive rotation into energy value plays amid growth sector uncertainty.
Why these names are trending (search momentum + weekly/monthly price action)
BABA (Mega-cap): Explosive +9.66% gap-up from $98.14 to $107.62 on earnings optimism. Weekly trend very strong (+12.13%) but monthly remains negative (-10.28%), suggesting relief rally within broader downtrend.
Energy Complex (All Mega/Large-cap):
- XOM: Weekly +3.32% vs monthly -5.78% – benefiting from oil surge despite longer-term headwinds
- CVX: Weekly +6.04% vs monthly -6.16% – similar energy sector dynamics
- OXY: Weekly +8.80% vs monthly -6.75% – strongest weekly momentum in the group
Search momentum drivers: Pre-earnings BABA speculation, crude oil geopolitical premium, and energy sector rotation themes dominating social/search activity.
Key news drivers
- BABA Earnings Catalyst: Reports of narrowing losses and AI price hikes driving pre-earnings optimism ahead of upcoming results
- Crude Oil Surge: >5% crude rally on geopolitical tensions (Iran deal concerns) benefiting entire energy complex
- AI Sector Headwinds: Samsung quarterly results disappointing, DeepSeek developing proprietary AI chips creating competitive concerns
- Semiconductor Weakness: Korean stocks extending 20% drop from peak as AI jitters spread globally
- Energy Sector Rotation: Traditional energy names gaining favor as growth/AI momentum stalls
Durable momentum ideas (mid/high-cap focus)
BABA (Mega-cap): Earnings-driven momentum could sustain through July 17th expiry if results beat lowered expectations. AI price hikes suggest pricing power recovery. However, monthly -10.28% trend indicates this may be relief rally rather than trend reversal.
Energy Complex Sustainability:
- CVX (Mega-cap): Strongest technical setup with +6.04% weekly momentum and integrated oil model providing stability
- XOM (Mega-cap): Defensive energy play with dividend support, though momentum more muted than peers
- OXY (Large-cap): Highest beta to crude prices, best positioned for continued oil strength but also highest risk
Momentum sustainability factors: Crude oil technical breakout, geopolitical premium persistence, and potential continued rotation from growth to value sectors.
Options / structure ideas
*This is educational content and not financial advice. Verify current option prices and liquidity before any trades.*
BABA – Primary: CALL
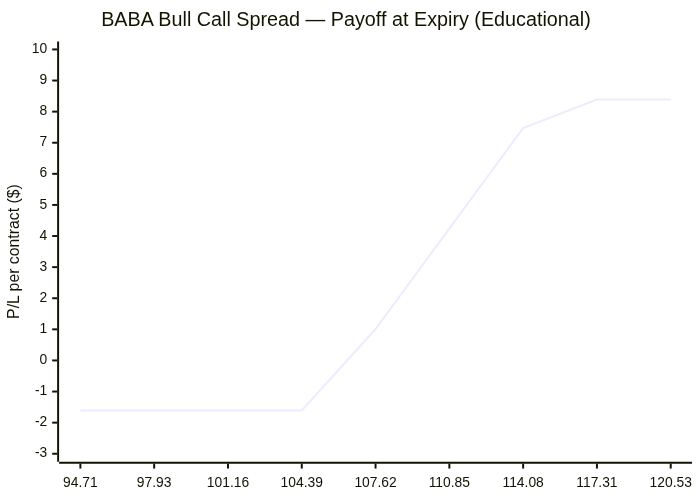
- Structure: 108C/112C call debit spread (July 17th) to capture earnings momentum
- Rationale: Gap-up momentum + earnings catalyst
- Risk: Monthly downtrend, poor liquidity (stale option quotes)
CVX – Primary: CALL
- Structure: 175C/180C call debit spread (July 17th)
- Alternative: Cash-secured put at 170 strike
- Rationale: Oil momentum + strongest energy weekly trend
XOM – Primary: PUT
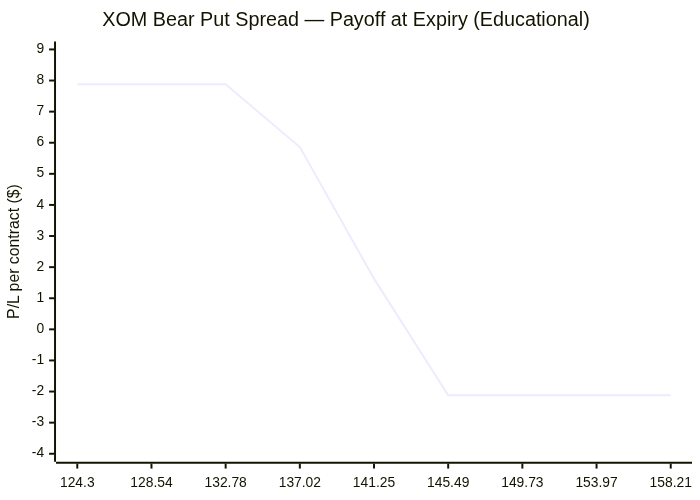
- Structure: 141P/139P put debit spread (July 17th)
- Rationale: Weakest energy momentum, monthly downtrend dominance
- Risk: Geopolitical oil premium could extend
OXY – Primary: CALL
- Structure: 53C/55C call debit spread (July 17th)
- Rationale: Highest oil beta, strongest weekly momentum (+8.8%)
- Risk: High volatility, monthly downtrend
Critical liquidity warning: All reviewed option chains showing $0.00 bid/ask spreads, indicating stale data or poor liquidity. Verify live quotes before execution.
Risks & watch-outs
Immediate risks:
- Options liquidity crisis: All major names showing poor option market depth
- Energy reversal risk: Geopolitical oil premium could fade quickly
- BABA earnings volatility: High expectations could lead to "sell the news" reaction
- AI sector contagion: Semiconductor weakness could spread to broader tech
Structural concerns:
- Monthly trends negative: All energy names showing monthly declines despite weekly strength
- Rotation sustainability: Energy rally may be tactical rather than strategic shift
- Earnings season risk: July 31st CVX earnings could create sector volatility
Key levels to watch: BABA $105 support, CVX $170 support, crude oil technical levels for energy sustainability.
Visual strategy maps
Payoff curves and entry/exit zones below are educational aids — not trade instructions. Confirm with your own chart, liquidity, and risk limits.
BABA: Bull Call Spread
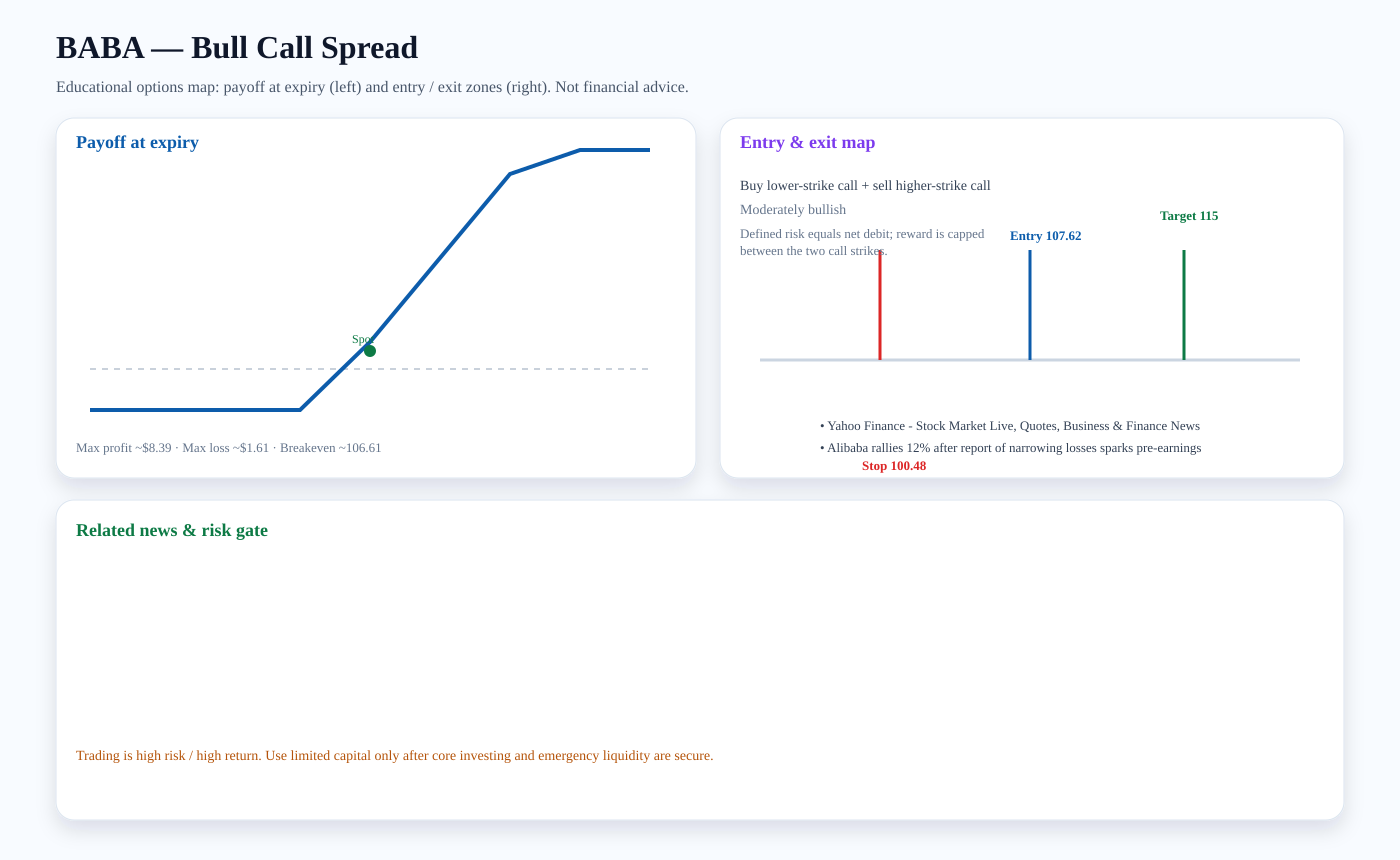
Structure: Buy lower-strike call + sell higher-strike call
Outlook: Moderately bullish
Entry zone: ~107.62 · Target: ~115 · Stop: ~100.48 · Breakeven: ~106.61
Risk note: Defined risk equals net debit; reward is capped between the two call strikes.
Related news links:
Payoff chart (Mermaid):
Entry / exit map (Mermaid):

XOM: Bear Put Spread
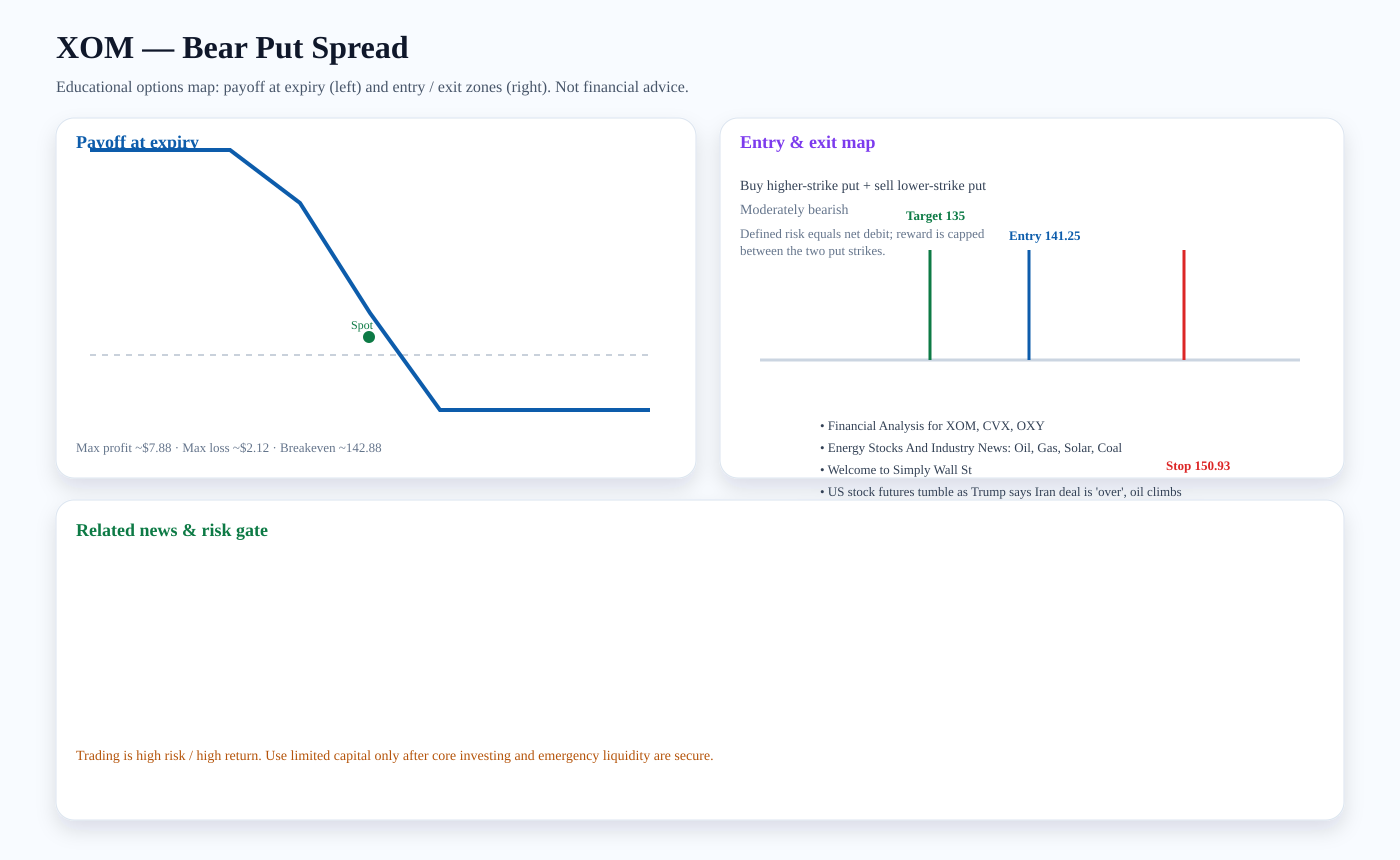
Structure: Buy higher-strike put + sell lower-strike put
Outlook: Moderately bearish
Entry zone: ~141.25 · Target: ~135 · Stop: ~150.93 · Breakeven: ~142.88
Risk note: Defined risk equals net debit; reward is capped between the two put strikes.
Related news links:
Payoff chart (Mermaid):
Entry / exit map (Mermaid):

CVX: Bull Call Spread
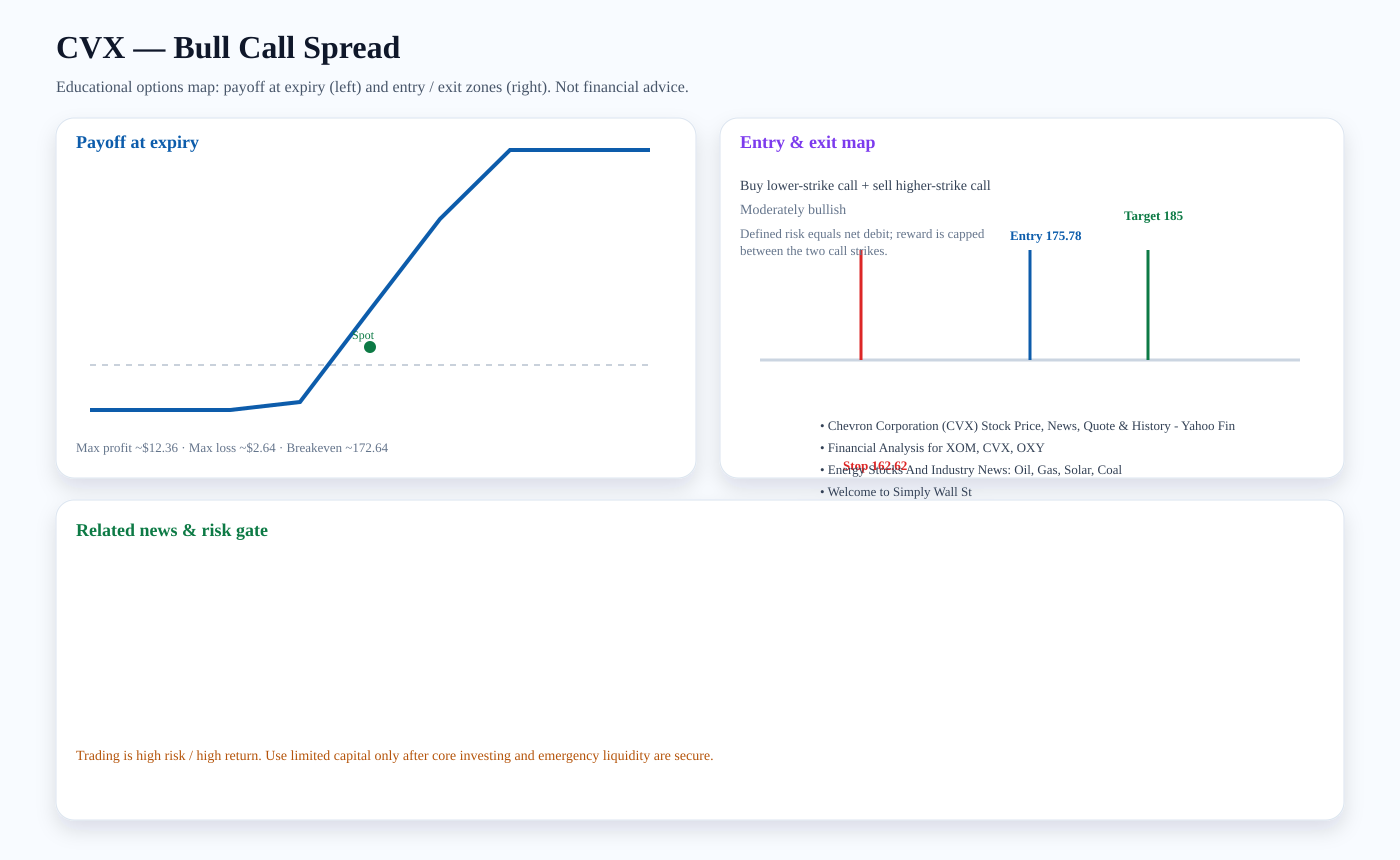
Structure: Buy lower-strike call + sell higher-strike call
Outlook: Moderately bullish
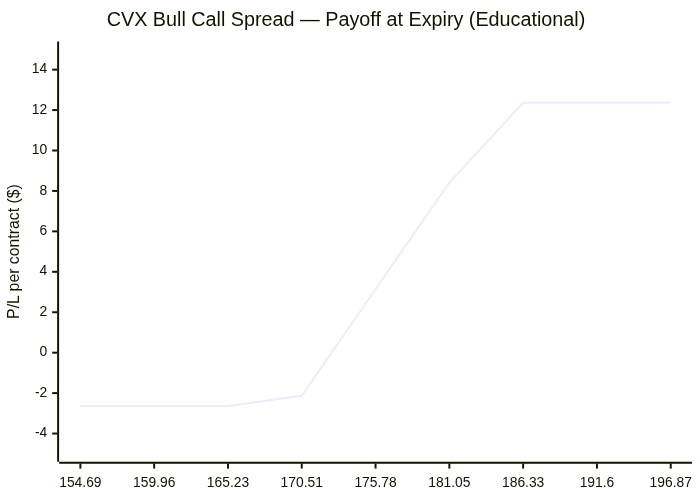
Entry zone: ~175.78 · Target: ~185 · Stop: ~162.62 · Breakeven: ~172.64
Risk note: Defined risk equals net debit; reward is capped between the two call strikes.
Related news links:
Payoff chart (Mermaid):
Entry / exit map (Mermaid):

OXY: Bull Call Spread
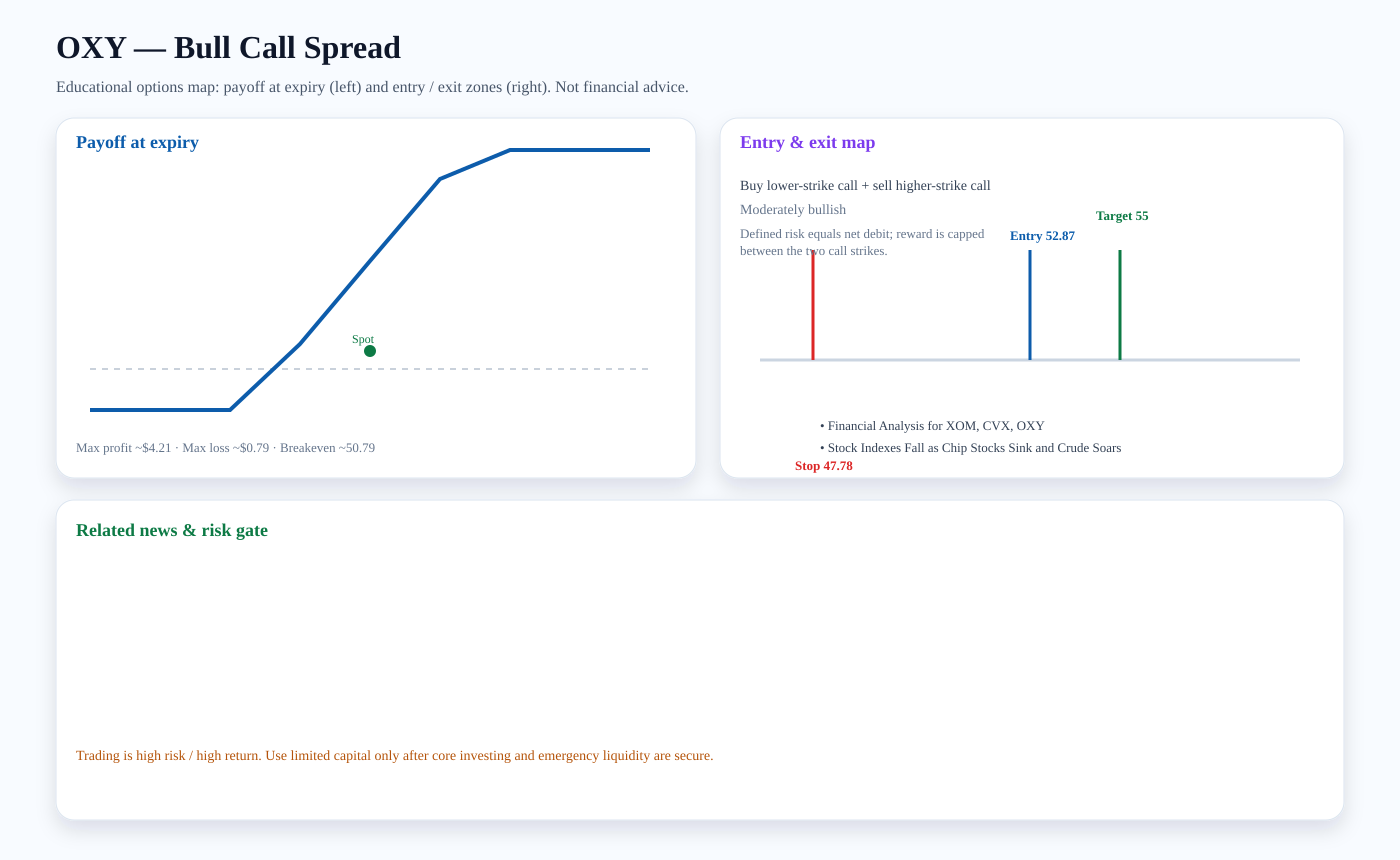
Structure: Buy lower-strike call + sell higher-strike call
Outlook: Moderately bullish
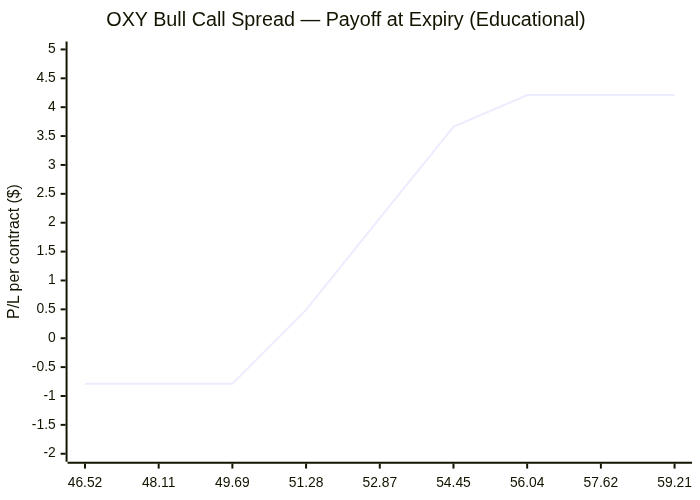
Entry zone: ~52.87 · Target: ~55 · Stop: ~47.78 · Breakeven: ~50.79
Risk note: Defined risk equals net debit; reward is capped between the two call strikes.
Related news links:
Payoff chart (Mermaid):
Entry / exit map (Mermaid):

Trading versus investing
Investing focuses on durable ownership, diversification, and compounding. Trading seeks faster tactical returns and carries higher risk. We treat options trading as limited-capital, educational analysis only after core investment capital and emergency liquidity are protected.
PDF report — Premium
Premium members get the full PDF attached to email briefs and can download it here. Upgrade for just $2 a month.
Subscribe for $2/month