
US Market Intelligence Brief
Report as-of (US/Eastern): 2026-07-13 15:32:04 EDT
Executive summary
Market Date: July 13, 2026, 3:32 PM EDT
The US market shows mixed signals with AI/enterprise software names dominating trending lists. Oracle (ORCL) leads search volume despite declining -5.75% as AI earnings momentum conflicts with current price action. Strong performers include Figma (+10.11%), Chipotle (+3.48%), and Intuit (+4.79%), while growth names like AppLovin (-12.57%) and SpaceX (-4.94%) face selling pressure. The session reflects a rotation toward established enterprise players with sustainable AI monetization versus speculative growth stories.
Market regime check
Based on available data, the S&P 500 shows -0.31% decline to 7,551.77, suggesting modest risk-off sentiment. The trending names indicate a quality rotation within technology, favoring established enterprise software (INTU, ORCL) over high-multiple growth stocks (APP, SPCX). This pattern suggests investors are becoming more selective within AI/tech themes, demanding clearer monetization paths rather than pure growth narratives.
No major sector ETF data available, but the mix of mega-cap (ORCL, SPCX) and large-mid cap names (FIG, CMG, INTU, APP) suggests broad-based individual stock selection rather than sector-wide moves.
Why these names are trending
Search momentum drivers:
- ORCL: Highest search volume despite price decline – AI earnings milestone headlines creating cognitive dissonance with -33.9% monthly performance
- FIG: Strong technical breakout (+10.11% today, +17.46% monthly) driving momentum scanner alerts
- INTU: Steady enterprise software demand (+4.79% today, +6.35% weekly) in quality rotation
- APP: High-volume decline (-12.57%) triggering volatility-based trending algorithms
- SPCX: Mega-cap status amplifying -4.94% move across 60.7M volume
Price action context: Winners show sustained multi-week trends (FIG +17.46% monthly, CMG +19.9% monthly), while losers reflect recent momentum breaks (APP -18.48% weekly, SPCX -13.9% weekly).
Key news drivers
Oracle contradiction: Headlines emphasize "AI demand spurs earnings milestone not seen in 15 years" and "stock surges," yet ORCL trades down -5.75% with -33.9% monthly decline. This disconnect suggests either stale news aggregation or market skepticism about AI monetization timeline despite positive fundamentals.
Broader AI theme: Multiple references to AI-focused workloads, enterprise AI adoption, and next-generation positioning across Oracle coverage. Secondary mentions of DigitalOcean (+171.2% YTD) and KLA's AI-focused results suggest continued enterprise infrastructure investment.
Tech leadership shifts: Apple suing OpenAI for hardware secrets and OpenAI leadership departures indicate ongoing competitive dynamics in AI ecosystem, potentially benefiting established enterprise players like Oracle and Intuit.
Durable momentum ideas
Quality enterprise software (INTU, potential ORCL reversal): Intuit's +4.79% move on +6.35% weekly trend reflects sustainable small business digitization. Oracle's technical oversold condition (-33.9% monthly) may create reversal opportunity if AI infrastructure demand materializes.
Design/collaboration tools (FIG): Figma's +17.46% monthly gain suggests sustained enterprise adoption of design platforms. Remote work permanence and design system standardization provide durable tailwinds.
Consumer discretionary recovery (CMG): Chipotle's +19.9% monthly performance indicates consumer spending resilience in premium fast-casual segment. Operational improvements and unit expansion support continued momentum.
Avoid high-multiple growth (APP, SPCX): AppLovin's -18.48% weekly decline and SpaceX's -13.9% weekly drop reflect multiple compression in rate-sensitive growth names. Momentum likely continues lower until valuation reset completes.
Options / structure ideas
*This is educational content and not financial advice.*
Primary bullish plays:
- FIG call spreads: Buy 23C/Sell 25C targeting momentum continuation (primary structure)
- CMG call spreads: Buy 36C/Sell 38C on consumer strength (primary structure)
- INTU call spreads: Buy 288C/Sell 295C on enterprise software durability (primary structure)
Primary bearish plays:
- ORCL put spreads: Buy 133P/Sell 130P on technical breakdown despite AI headlines (primary structure)
- APP put spreads: Buy 442.5P/Sell 435P on growth multiple compression (primary structure)
- SPCX put spreads: Buy 138P/Sell 135P on mega-cap momentum break (primary structure)
Secondary structures: Cash-secured puts on quality names (INTU, FIG) for entry on pullbacks; covered calls on declining positions (ORCL, APP) for income generation.
Risks & watch-outs
Headline vs. price action divergence: Oracle's positive AI coverage conflicting with -5.75% daily/-33.9% monthly decline suggests either market inefficiency or fundamental skepticism requiring resolution.
Short-term expiry risk: 4-day expiry (July 17) creates high gamma/theta exposure across all structures. Quick directional moves required for profitability.
AI theme fatigue: Multiple AI-related departures (OpenAI leadership) and legal disputes (Apple vs. OpenAI) may signal peak hype, pressuring AI-adjacent names.
Quality rotation sustainability: Current preference for established enterprise software over growth may reverse quickly if rate expectations shift or growth names reach oversold extremes.
Earnings season proximity: Mid-July timing suggests potential earnings-related volatility that could overwhelm technical patterns and momentum trades.
Visual strategy maps
Payoff curves and entry/exit zones below are educational aids — not trade instructions. Confirm with your own chart, liquidity, and risk limits.
ORCL: Bear Put Spread
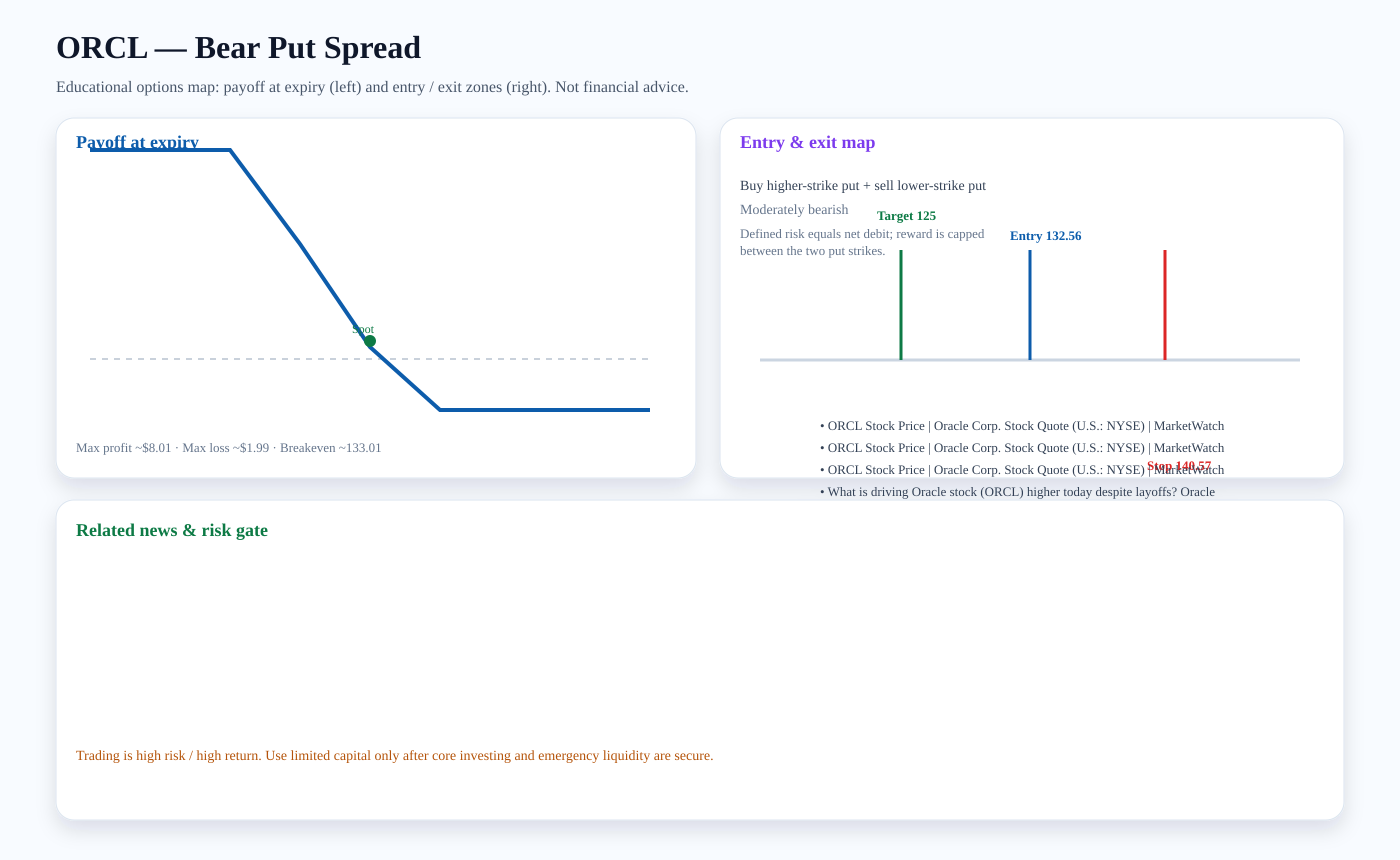
Structure: Buy higher-strike put + sell lower-strike put
Outlook: Moderately bearish
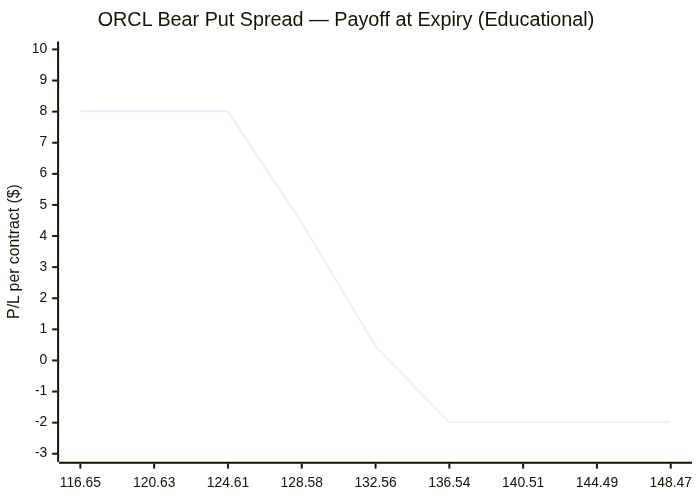
Entry zone: ~132.56 · Target: ~125 · Stop: ~140.57 · Breakeven: ~133.01
Risk note: Defined risk equals net debit; reward is capped between the two put strikes.
Related news links:
Payoff chart (Mermaid):
Entry / exit map (Mermaid):

APP: Bear Put Spread
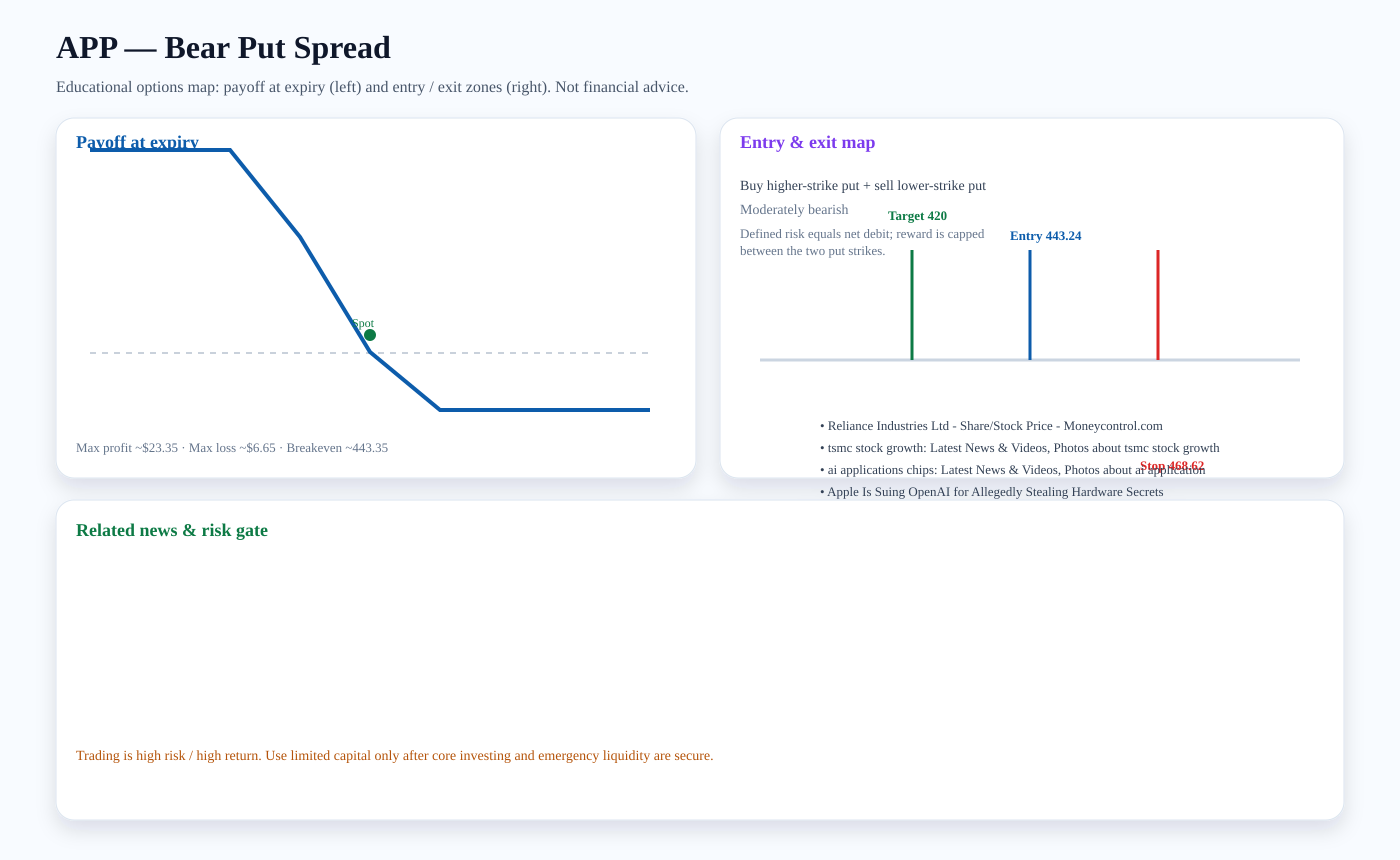
Structure: Buy higher-strike put + sell lower-strike put
Outlook: Moderately bearish
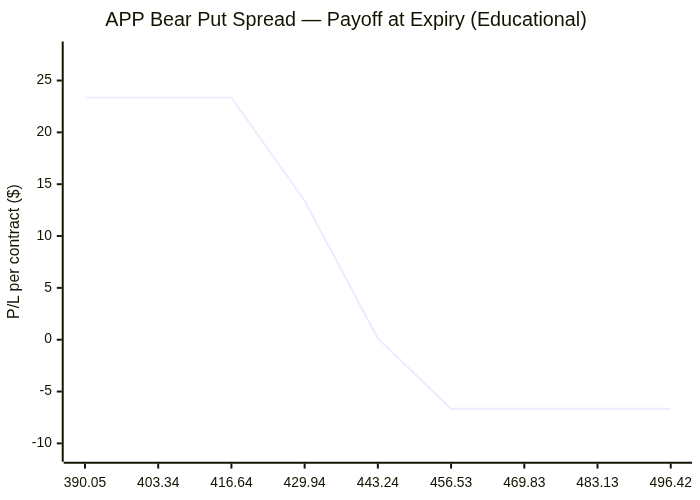
Entry zone: ~443.24 · Target: ~420 · Stop: ~468.62 · Breakeven: ~443.35
Risk note: Defined risk equals net debit; reward is capped between the two put strikes.
Related news links:
Payoff chart (Mermaid):
Entry / exit map (Mermaid):

FIG: Bull Call Spread
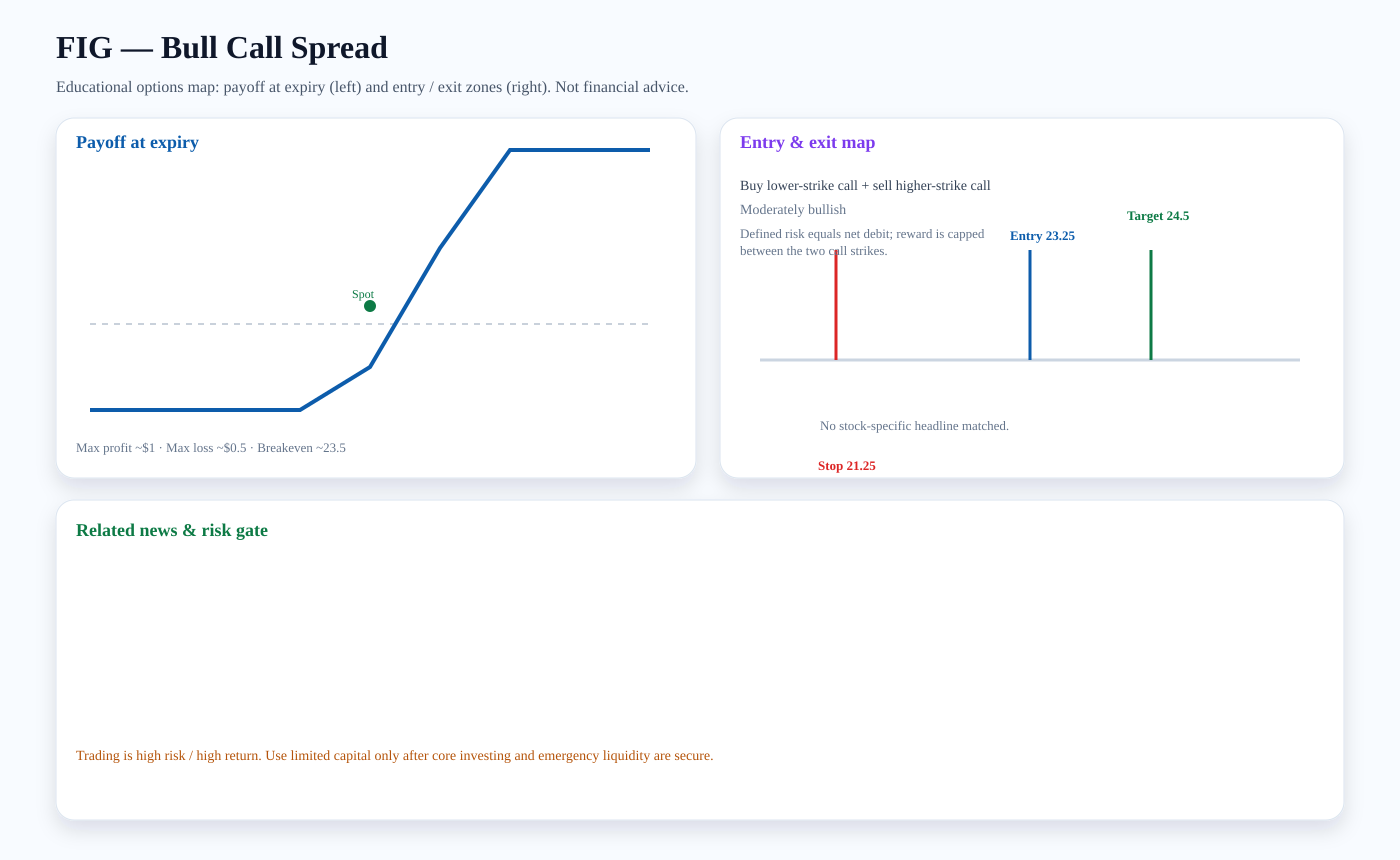
Structure: Buy lower-strike call + sell higher-strike call
Outlook: Moderately bullish
Entry zone: ~23.25 · Target: ~24.5 · Stop: ~21.25 · Breakeven: ~23.5
Risk note: Defined risk equals net debit; reward is capped between the two call strikes.
Payoff chart (Mermaid):
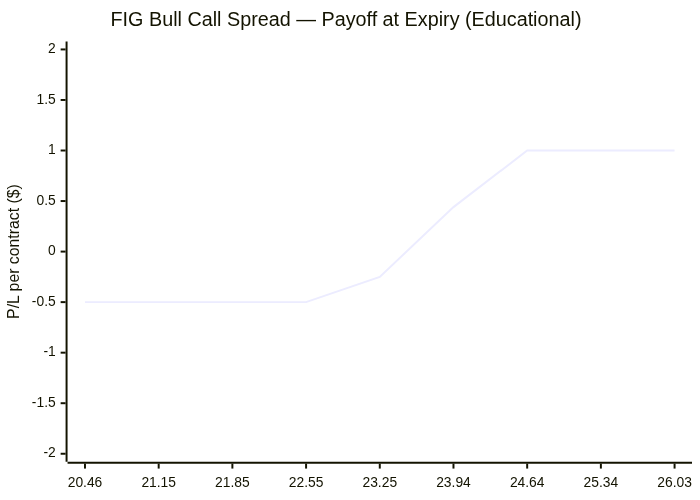
Entry / exit map (Mermaid):

CMG: Bull Call Spread
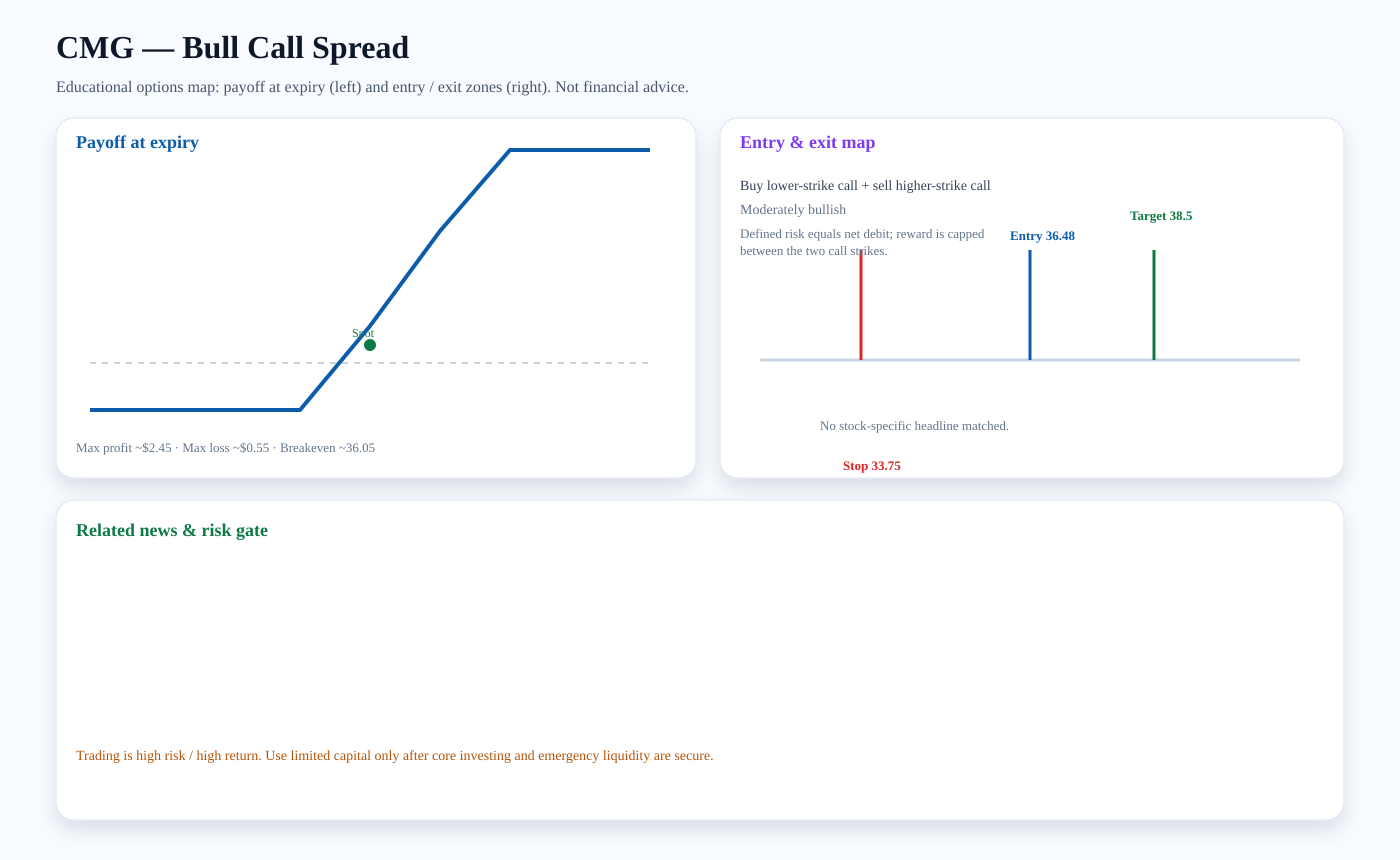
Structure: Buy lower-strike call + sell higher-strike call
Outlook: Moderately bullish
Entry zone: ~36.48 · Target: ~38.5 · Stop: ~33.75 · Breakeven: ~36.05
Risk note: Defined risk equals net debit; reward is capped between the two call strikes.
Payoff chart (Mermaid):
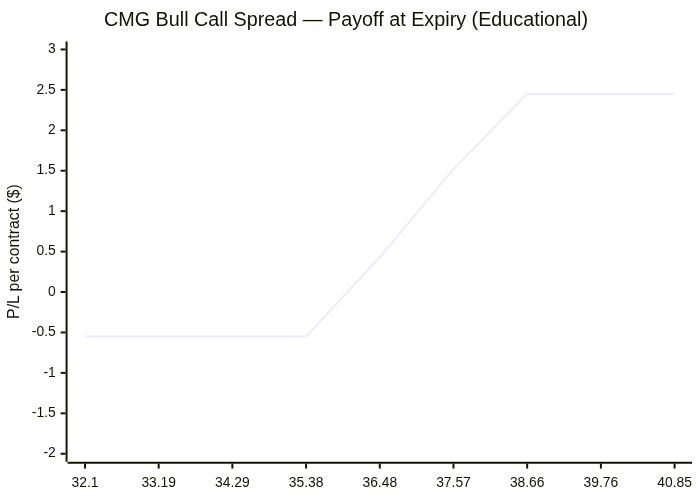
Entry / exit map (Mermaid):

Trading versus investing
Investing focuses on durable ownership, diversification, and compounding. Trading seeks faster tactical returns and carries higher risk. We treat options trading as limited-capital, educational analysis only after core investment capital and emergency liquidity are protected.
PDF report — Premium
Premium members get the full PDF attached to email briefs and can download it here. Upgrade for just $2 a month.
Subscribe for $2/month