
US Market Intelligence Brief
Report as-of (US/Eastern): 2026-07-14 09:05:15 EDT
Executive summary
Report as-of (US/Eastern): 2026-07-14 09:05:15 EDT
Major bank earnings dominate today's market narrative, with mixed pre-market results creating divergent opportunities. Goldman Sachs (+2.69%) leads after posting 78% profit growth, while IBM (-20.96%) suffers a massive gap down and Oracle (-7.26%) extends its monthly decline. Banking sector shows resilience with strong monthly trends (+4-9%) despite near-term volatility ahead of JPM, BAC, and WFC earnings. ServiceNow (-4.70%) retreats despite raising AI targets to $1.5B. Market regime appears earnings-driven with sector rotation favoring financials over tech.
Market regime check (S&P 500 + sector/thematic ETFs)
Banking sector leadership evident through trending names (JPM, BAC, WFC, GS) with Goldman's strong Q2 results (+78% profit growth, $20.98 EPS) setting positive tone. However, tech weakness persists with Oracle extending monthly decline (-34.41%) and IBM's catastrophic -21% gap down. ServiceNow's retreat despite AI momentum suggests broader tech rotation concerns. Financial sector appears in earnings-driven rally mode while technology faces headwinds, indicating potential sector rotation from growth to value/financials.
Why these names are trending (search momentum + weekly/monthly price action)
Banking dominance: JPM, BAC, WFC, GS all reporting Q2 earnings today with Goldman's strong results creating sector momentum. Monthly trends remain robust (BAC +9.09%, JPM +8.70%, WFC +6.95%) despite recent weekly softness.
Tech under pressure: IBM's -21% gap suggests major fundamental deterioration, while Oracle's -34.41% monthly decline reflects sustained weakness. ServiceNow (-4.70%) trending despite raising AI contract targets to $1.5B, indicating broader tech skepticism.
Earnings catalyst: Major bank earnings create immediate trading opportunities with defined catalysts and clear directional bias based on Goldman's outperformance.
Key news drivers
- Goldman Sachs earnings beat: Q2 profit of $6.63B (+78% YoY), $20.98 EPS, revenue +39% – setting high bar for peer banks
- Major bank earnings today: JPM, BAC, WFC, Citigroup all reporting Q2 results with expectations for strong Main Street spending benefits
- ServiceNow AI expansion: Raising Now Assist AI contract target to $1.5B despite stock weakness
- IBM fundamental concerns: -21% gap down suggests major earnings miss or guidance cut (specific catalyst unclear from available data)
- Oracle continued decline: -34.41% monthly performance indicates sustained fundamental or sentiment issues
Durable momentum ideas (mid/high-cap focus; include why momentum may sustain)
Goldman Sachs (GS) – Primary momentum leader with +2.69% pre-market following strong earnings. Investment banking recovery and trading revenue strength could sustain outperformance through earnings season.
Bank of America (BAC) – Strongest monthly trend (+9.09%) with earnings catalyst today. Consumer banking exposure to Main Street spending could drive continued strength if results meet Goldman's high bar.
Oracle (ORCL) – Contrarian opportunity – Oversold after -34.41% monthly decline, but cloud transition concerns may persist. Momentum likely remains negative until fundamental catalyst emerges.
ServiceNow (NOW) – AI story intact with $1.5B contract target, but broader tech rotation headwinds. Momentum sustainability depends on sector sentiment recovery.
Options / structure ideas (repeat disclaimer; include both call-side and put-side structures, and identify which side is primary)
*This is educational content and not financial advice.*
Goldman Sachs (GS) – Primary: CALL
- Call debit spread 1085/1095 (2026-07-17) to capture earnings momentum
- Put-side: Cash-secured puts at 1050 for income if willing to own on pullback
Bank of America (BAC) – Primary: CALL
- Call debit spread 60/61 (2026-07-17) targeting earnings beat above $60 resistance
- Put-side: Cash-secured put at $59 for premium collection
IBM (IBM) – Primary: PUT
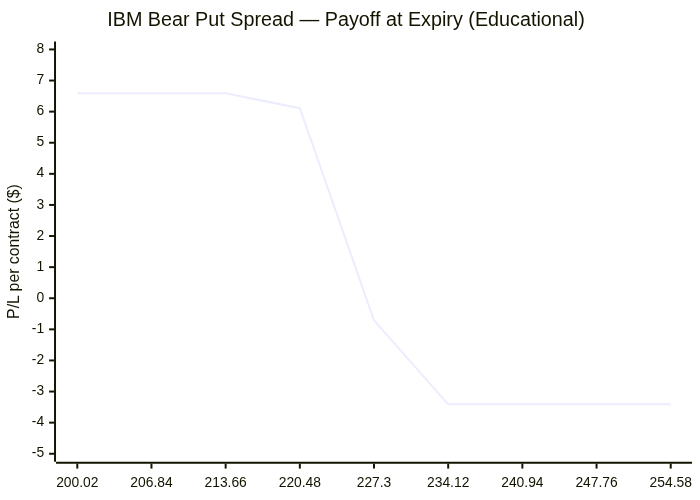
- Put debit spread 230/220 (2026-07-17) on continued weakness from -21% gap
- Call-side: Wait for dead-cat bounce before covered calls
- Risk: Poor options liquidity with $0 bid/ask spreads
Oracle (ORCL) – Primary: PUT
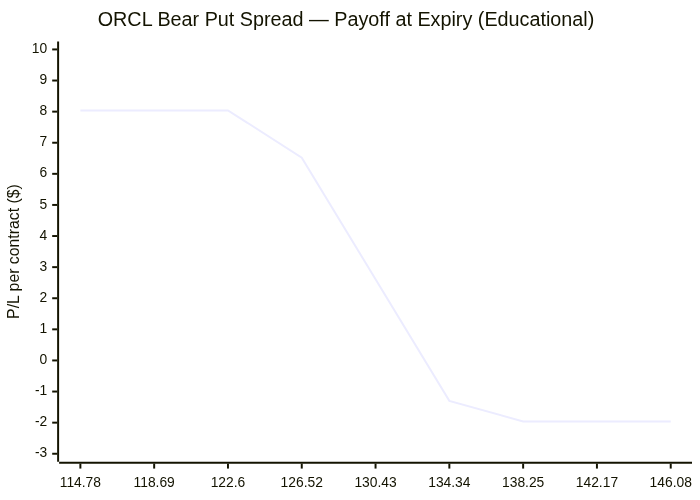
- Put debit spread 130/125 (2026-07-17) on oversold continuation
- Call-side: Covered calls if holding shares given strong downtrend
JPMorgan (JPM) – Primary: PUT
- Put debit spread 330/325 (2026-07-17) on potential earnings disappointment
- Call-side: Call spread 330/335 if earnings drive recovery above $330
Risks & watch-outs
Immediate risks:
- Major bank earnings volatility today could gap stocks significantly either direction
- Extremely short 3-day option expiries (2026-07-17) create high time decay risk
- Poor options liquidity on several names (IBM, WFC) with $0 bid/ask spreads requiring live quote verification
Sector risks:
- Banking sector vulnerable to credit concerns or interest rate shifts
- Tech rotation may accelerate if earnings disappoint broadly
- Goldman's strong results set high bar for peer banks – disappointments could trigger sharp reversals
Structural concerns:
- ServiceNow's AI momentum disconnect suggests broader tech skepticism
- IBM's -21% gap indicates potential fundamental deterioration requiring investigation
- Oracle's sustained monthly decline (-34.41%) suggests deeper issues than temporary weakness
Visual strategy maps
Payoff curves and entry/exit zones below are educational aids — not trade instructions. Confirm with your own chart, liquidity, and risk limits.
ORCL: Bear Put Spread
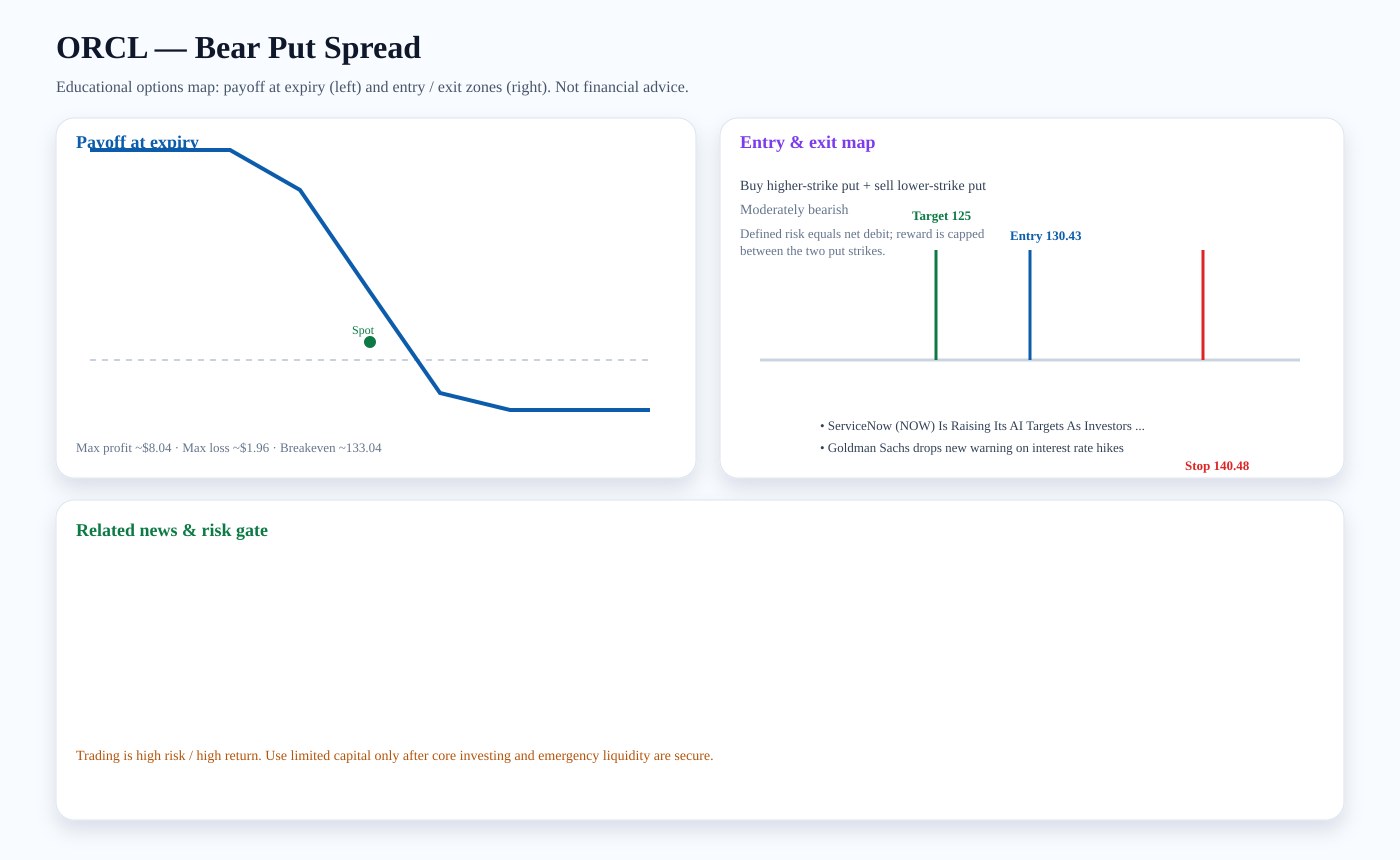
Structure: Buy higher-strike put + sell lower-strike put
Outlook: Moderately bearish
Entry zone: ~130.43 · Target: ~125 · Stop: ~140.48 · Breakeven: ~133.04
Risk note: Defined risk equals net debit; reward is capped between the two put strikes.
Related news links:
Payoff chart (Mermaid):
Entry / exit map (Mermaid):

IBM: Bear Put Spread
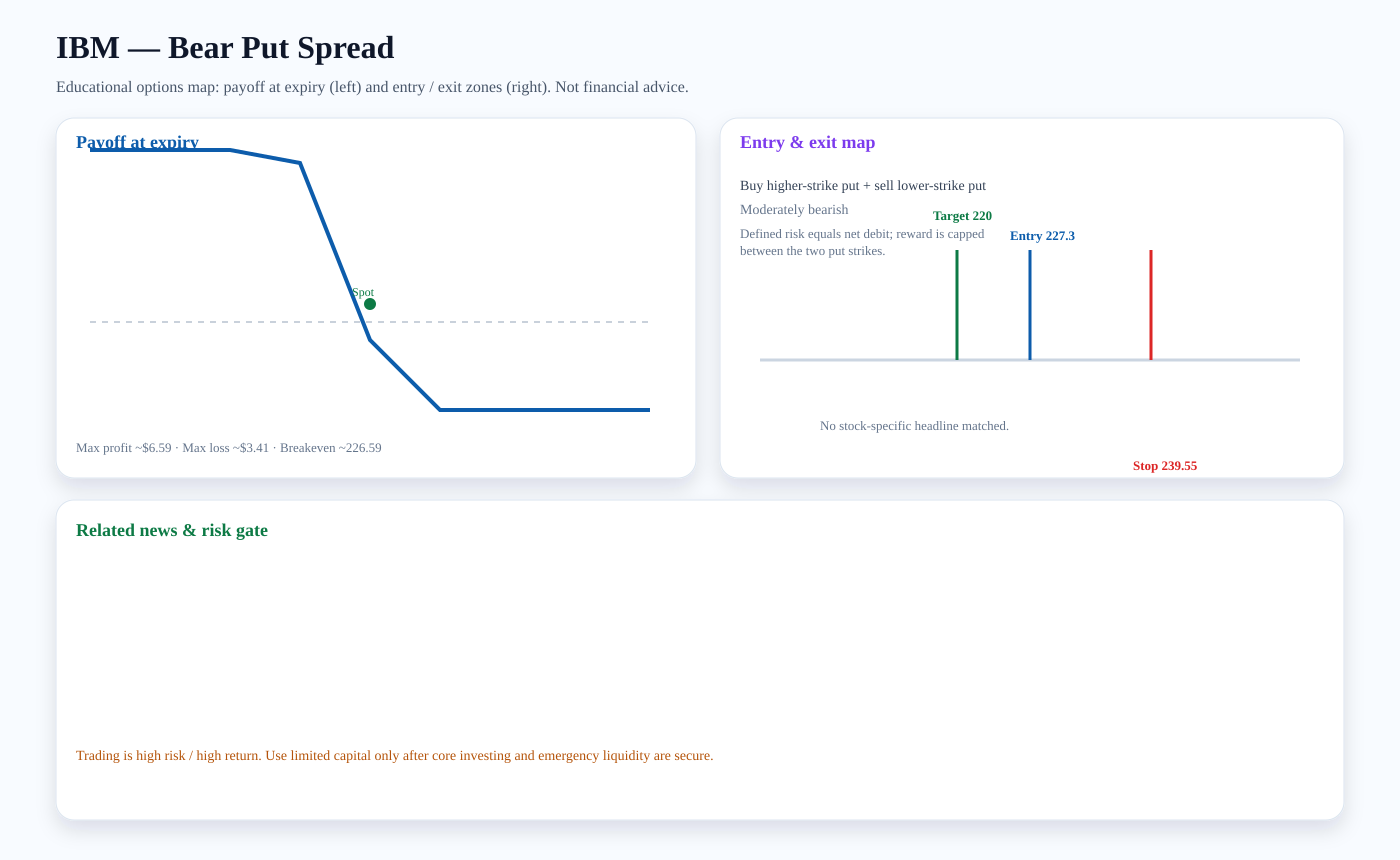
Structure: Buy higher-strike put + sell lower-strike put
Outlook: Moderately bearish
Entry zone: ~227.3 · Target: ~220 · Stop: ~239.55 · Breakeven: ~226.59
Risk note: Defined risk equals net debit; reward is capped between the two put strikes.
Payoff chart (Mermaid):
Entry / exit map (Mermaid):

JPM: Bear Put Spread
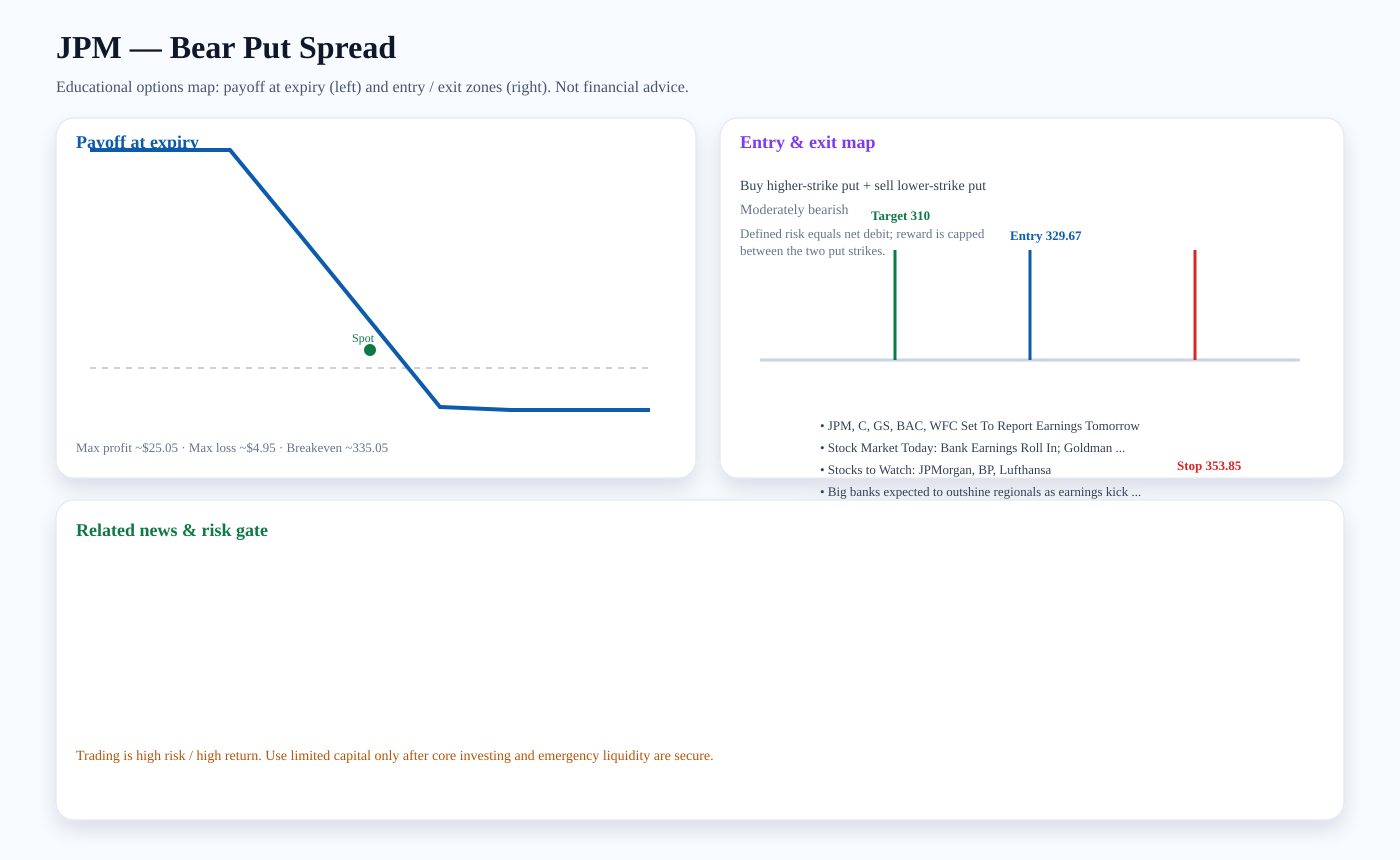
Structure: Buy higher-strike put + sell lower-strike put
Outlook: Moderately bearish
Entry zone: ~329.67 · Target: ~310 · Stop: ~353.85 · Breakeven: ~335.05
Risk note: Defined risk equals net debit; reward is capped between the two put strikes.
Related news links:
Payoff chart (Mermaid):
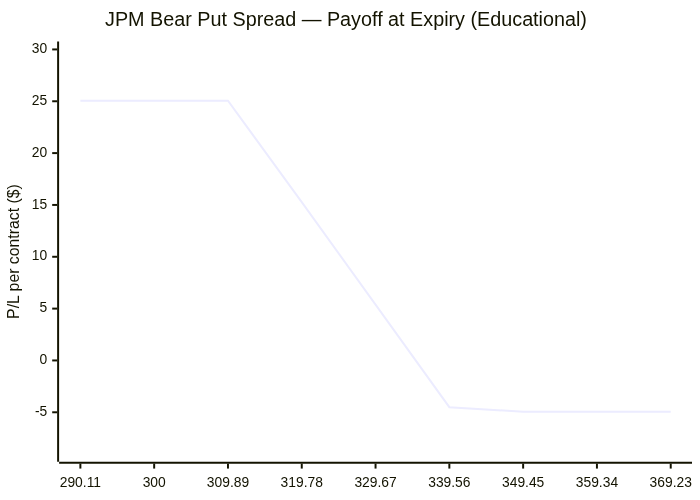
Entry / exit map (Mermaid):

BAC: Bull Call Spread
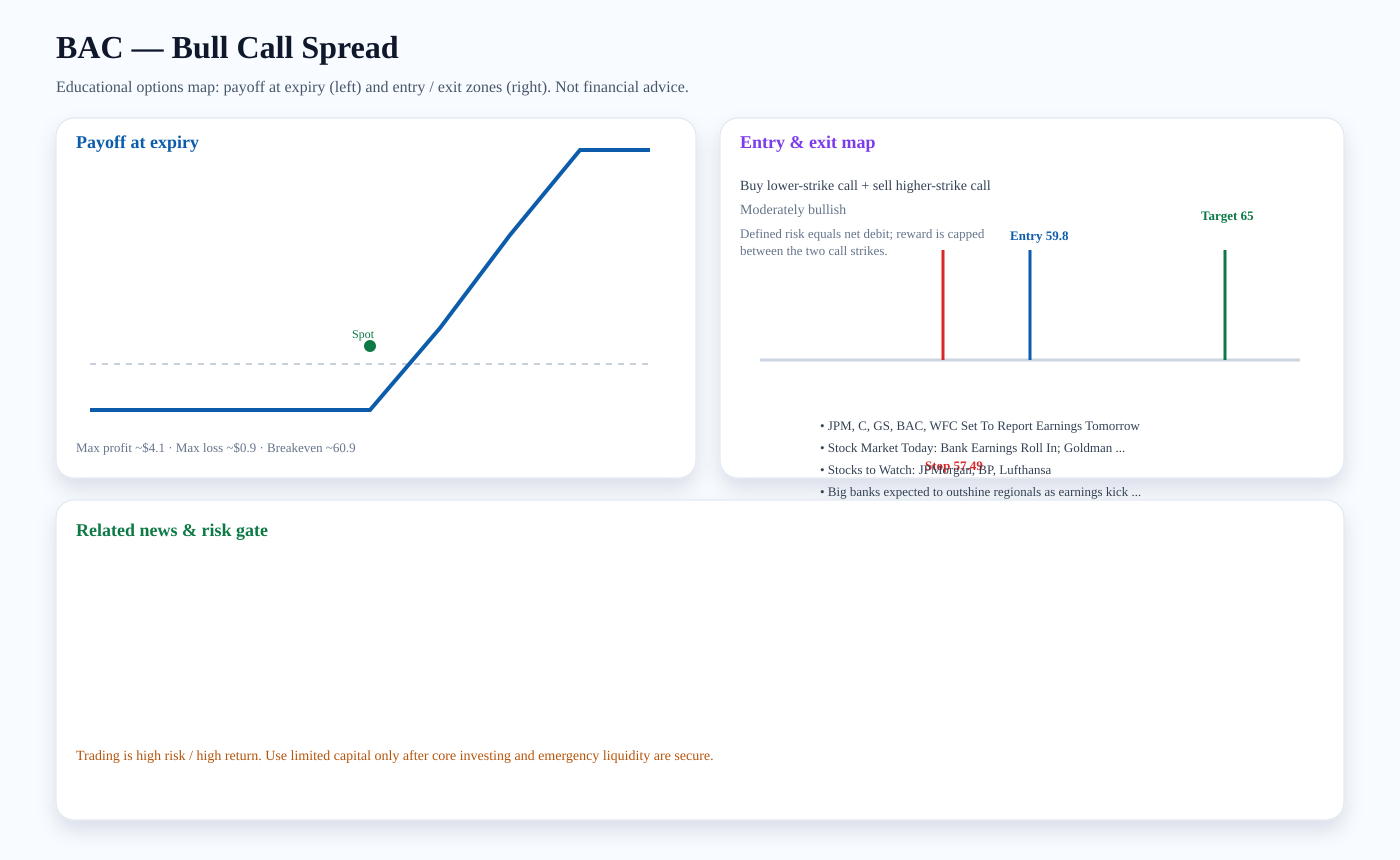
Structure: Buy lower-strike call + sell higher-strike call
Outlook: Moderately bullish
Entry zone: ~59.8 · Target: ~65 · Stop: ~57.49 · Breakeven: ~60.9
Risk note: Defined risk equals net debit; reward is capped between the two call strikes.
Related news links:
Payoff chart (Mermaid):
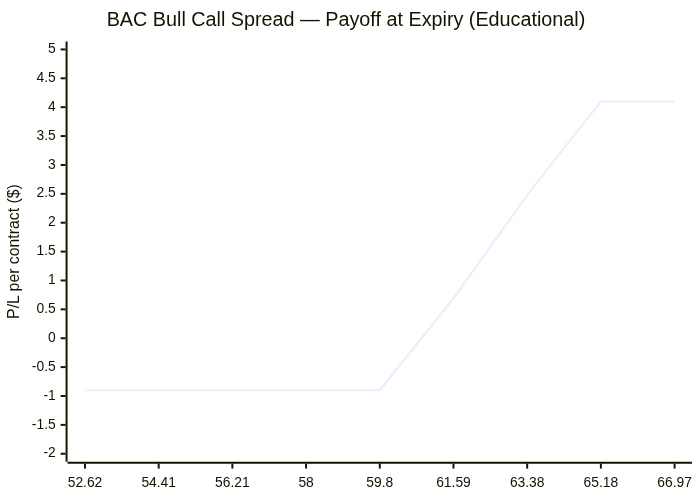
Entry / exit map (Mermaid):

Trading versus investing
Investing focuses on durable ownership, diversification, and compounding. Trading seeks faster tactical returns and carries higher risk. We treat options trading as limited-capital, educational analysis only after core investment capital and emergency liquidity are protected.
PDF report — Premium
Premium members get the full PDF attached to email briefs and can download it here. Upgrade for just $2 a month.
Subscribe for $2/month