
US Market Intelligence Brief
Report as-of (US/Eastern): 2026-07-14 09:31:38 EDT
Executive summary
Report as-of (US/Eastern): 2026-07-14 09:31:38 EDT
Major bank earnings are driving market attention today, with mixed results despite JPMorgan posting record quarterly profits. Goldman Sachs (+4.47%) leads gainers while ServiceNow (-6.34%) and IBM (-23.37%) face significant pressure. The banking sector shows divergent reactions to Q2 results, suggesting selective stock-picking over broad sector momentum. Tech names display weakness with Oracle down monthly (-27.8%) despite modest daily gains, indicating potential sector rotation from growth to value.
Market regime check (S&P 500 + sector/thematic ETFs)
Banking sector experiencing earnings-driven volatility with mixed signals – while JPM achieved record profits, individual stock reactions vary significantly. GS (+4.47%) and BAC (+0.07%) holding steady versus WFC (-3.39%) and JPM (-1.55%) selling off despite strong fundamentals. This suggests a "buy the rumor, sell the news" environment where strong earnings were already priced in.
Technology sector showing stress with IBM's -23.37% collapse and ServiceNow's -6.34% decline indicating potential rotation away from high-multiple growth names. Oracle's monthly -27.8% decline despite modest daily recovery suggests broader tech headwinds persist.
Why these names are trending (search momentum + weekly/monthly price action)
Banking dominance: JPM, BAC, WFC, and GS trending due to synchronized Q2 earnings releases today. Weekly performance ranges from GS (+4.85%) to WFC (-2.82%), showing divergent market expectations.
Tech under pressure: IBM's catastrophic -27.32% weekly decline and NOW's -5.88% weekly drop reflect broader growth stock rotation. ORCL's -6.13% weekly performance despite +0.58% daily bounce suggests oversold conditions.
Volume confirmation: IBM leading with 8.46M volume (vs 9.11M average), NOW at 3.12M, and ORCL at 4.04M indicating genuine institutional interest rather than retail speculation.
Key news drivers
Banking earnings catalyst: JPMorgan achieved "highest quarterly profit in US banking history" but stock declined -1.55%, exemplifying classic earnings disappointment despite strong fundamentals. Market expected even stronger results or guidance.
Sector rotation signals: Big banks benefiting from "Main Street spending" and corporate activity (SpaceX, Google deals mentioned), but individual stock reactions suggest selective positioning rather than broad sector enthusiasm.
AI/Tech headwinds: ServiceNow "raising AI targets" yet declining -6.34% indicates market skepticism about AI monetization timelines. Broader tech weakness from OpenAI leadership changes and regulatory concerns creating sector headwinds.
Durable momentum ideas (mid/high-cap focus)
Goldman Sachs (GS) – Strongest banking performer with +4.47% daily and +4.85% weekly gains. Investment banking recovery and trading revenues likely driving outperformance. Momentum may sustain through Q3 if capital markets activity continues.
Bank of America (BAC) – Most stable large bank with +8.01% monthly gains and minimal daily volatility (+0.07%). Consumer banking exposure to "Main Street spending" provides defensive growth characteristics.
Oracle (ORCL) – Potential oversold bounce candidate with -27.8% monthly decline creating value opportunity. Enterprise software demand and cloud transition provide fundamental support for recovery.
Options / structure ideas
*This is educational content and not financial advice.*
Primary focus: Banking sector post-earnings plays
GS (Primary: CALL) – Momentum continuation play via 1095/1105 call debit spread (Jul 17). Strong earnings reaction and weekly uptrend support further gains. Risk: IV crush post-earnings.
JPM (Primary: PUT) – Classic "sell the news" setup despite record profits. 330/325 put debit spread targets continued profit-taking. Risk: Earnings momentum reversal.
BAC (Primary: CALL) – Most stable bank with earnings today. 60/62.5 call debit spread captures upside while limiting cost. Risk: Sector rotation away from traditional banking.
IBM (Primary: PUT) – Catastrophic decline suggests fundamental issues. Put spreads risky due to poor liquidity, but covered calls viable if holding shares.
ORCL (Primary: CALL) – Oversold bounce play, but extremely poor options liquidity limits execution quality.
Risks & watch-outs
Liquidity crisis in options: Multiple names showing $0.00 bid/ask spreads despite volume, indicating stale quotes or market maker absence. Verify live spreads before any trades.
Earnings volatility crush: Post-announcement IV collapse could eliminate option profits even with correct directional calls.
Sector rotation uncertainty: Banking strength may not sustain if rate expectations shift; tech weakness could accelerate if growth concerns persist.
Short expiry risk: Jul 17 options (3 DTE) provide limited time for thesis development, amplifying time decay risks across all structures.
Visual strategy maps
Payoff curves and entry/exit zones below are educational aids — not trade instructions. Confirm with your own chart, liquidity, and risk limits.
IBM: Bear Put Spread
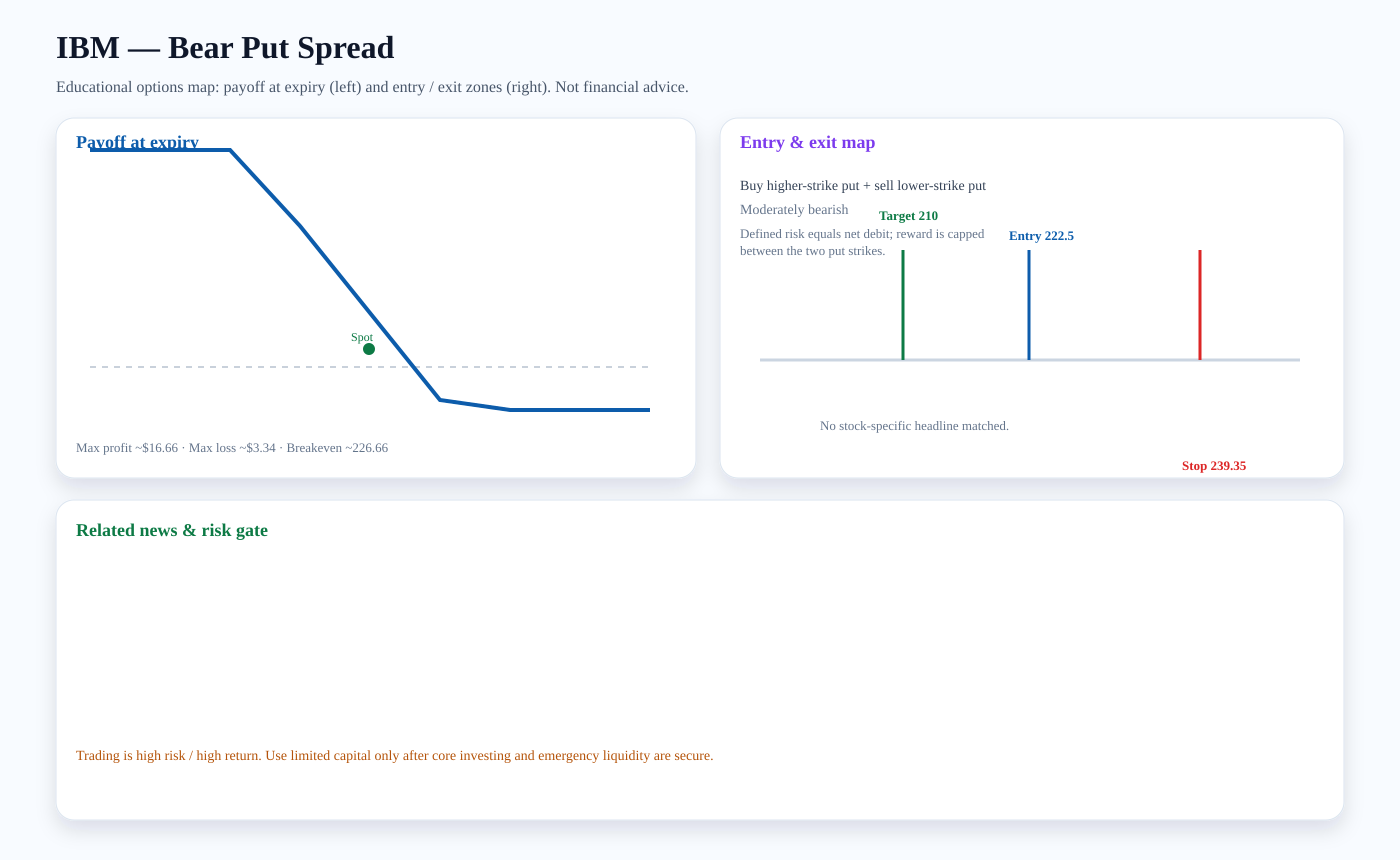
Structure: Buy higher-strike put + sell lower-strike put
Outlook: Moderately bearish
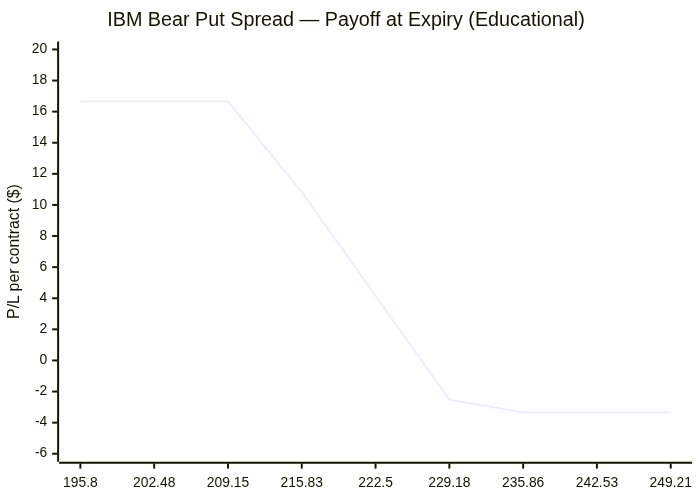
Entry zone: ~222.5 · Target: ~210 · Stop: ~239.35 · Breakeven: ~226.66
Risk note: Defined risk equals net debit; reward is capped between the two put strikes.
Payoff chart (Mermaid):
Entry / exit map (Mermaid):

ORCL: Bull Call Spread
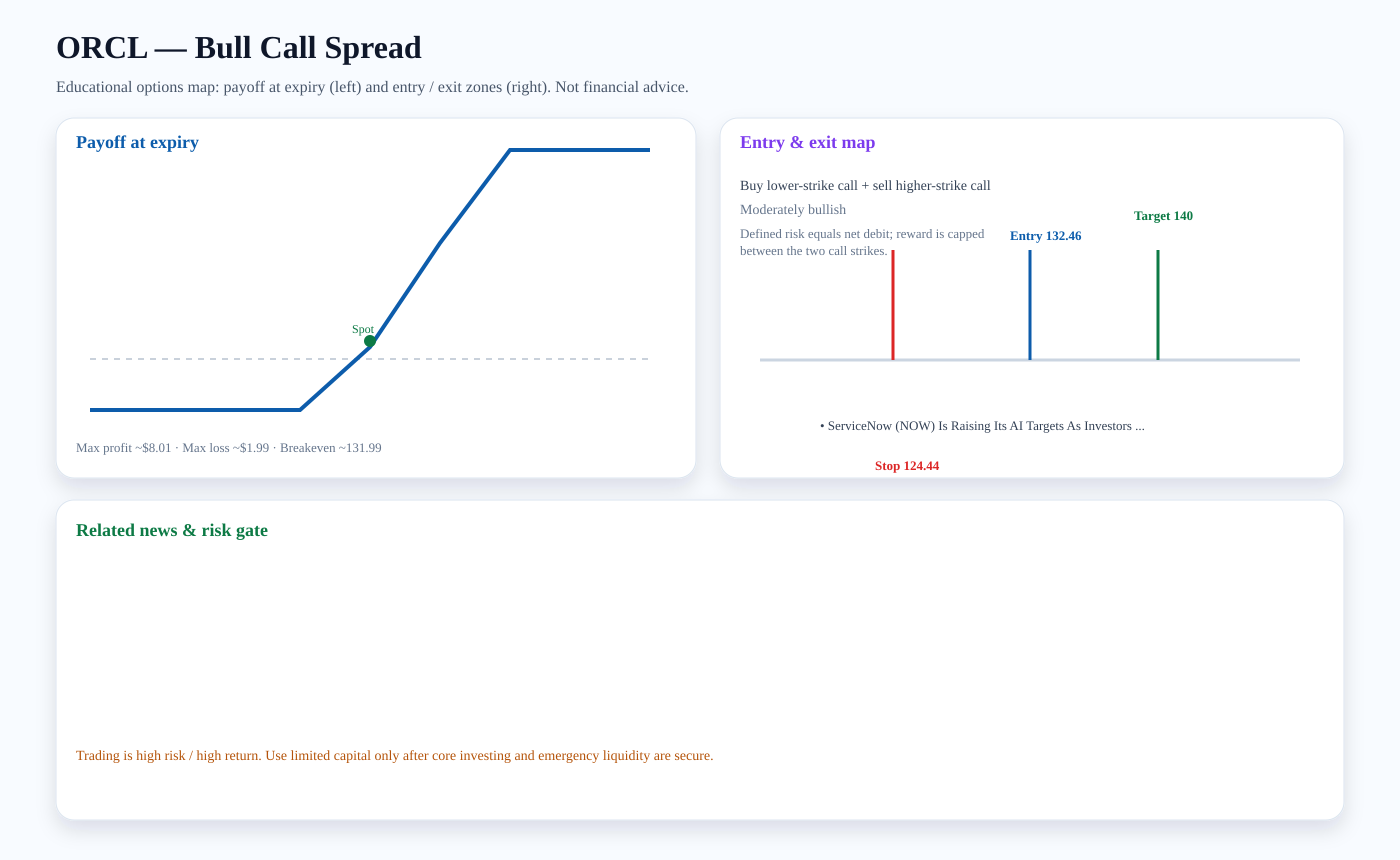
Structure: Buy lower-strike call + sell higher-strike call
Outlook: Moderately bullish
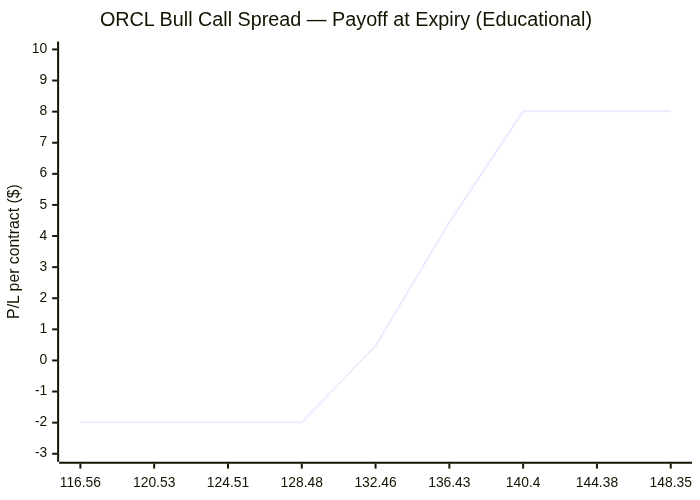
Entry zone: ~132.46 · Target: ~140 · Stop: ~124.44 · Breakeven: ~131.99
Risk note: Defined risk equals net debit; reward is capped between the two call strikes.
Related news links:
Payoff chart (Mermaid):
Entry / exit map (Mermaid):

JPM: Bear Put Spread
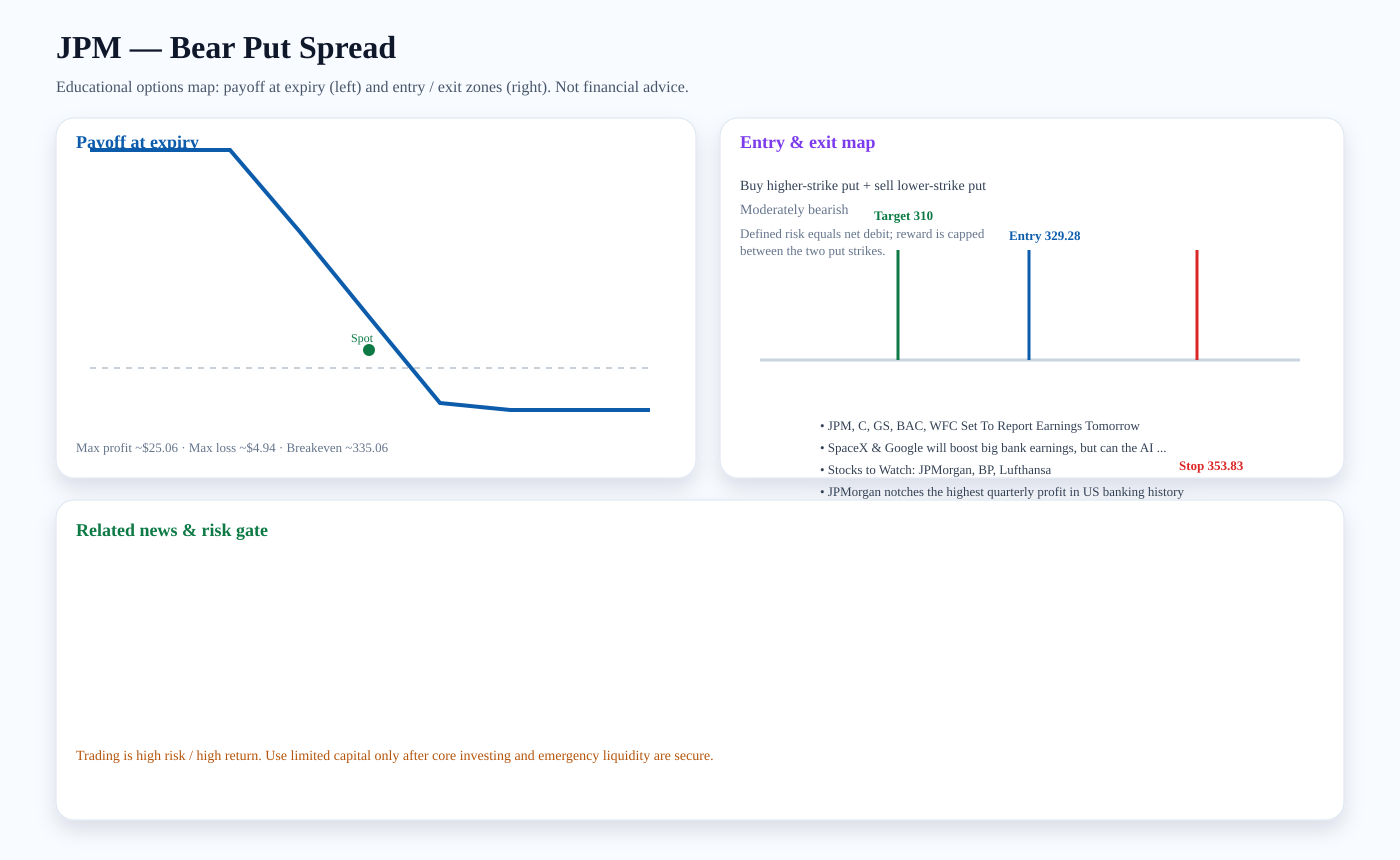
Structure: Buy higher-strike put + sell lower-strike put
Outlook: Moderately bearish
Entry zone: ~329.28 · Target: ~310 · Stop: ~353.83 · Breakeven: ~335.06
Risk note: Defined risk equals net debit; reward is capped between the two put strikes.
Related news links:
Payoff chart (Mermaid):
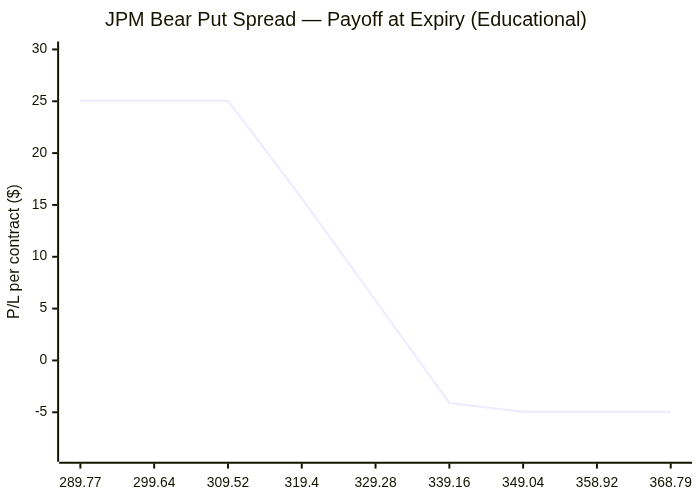
Entry / exit map (Mermaid):

BAC: Bull Call Spread
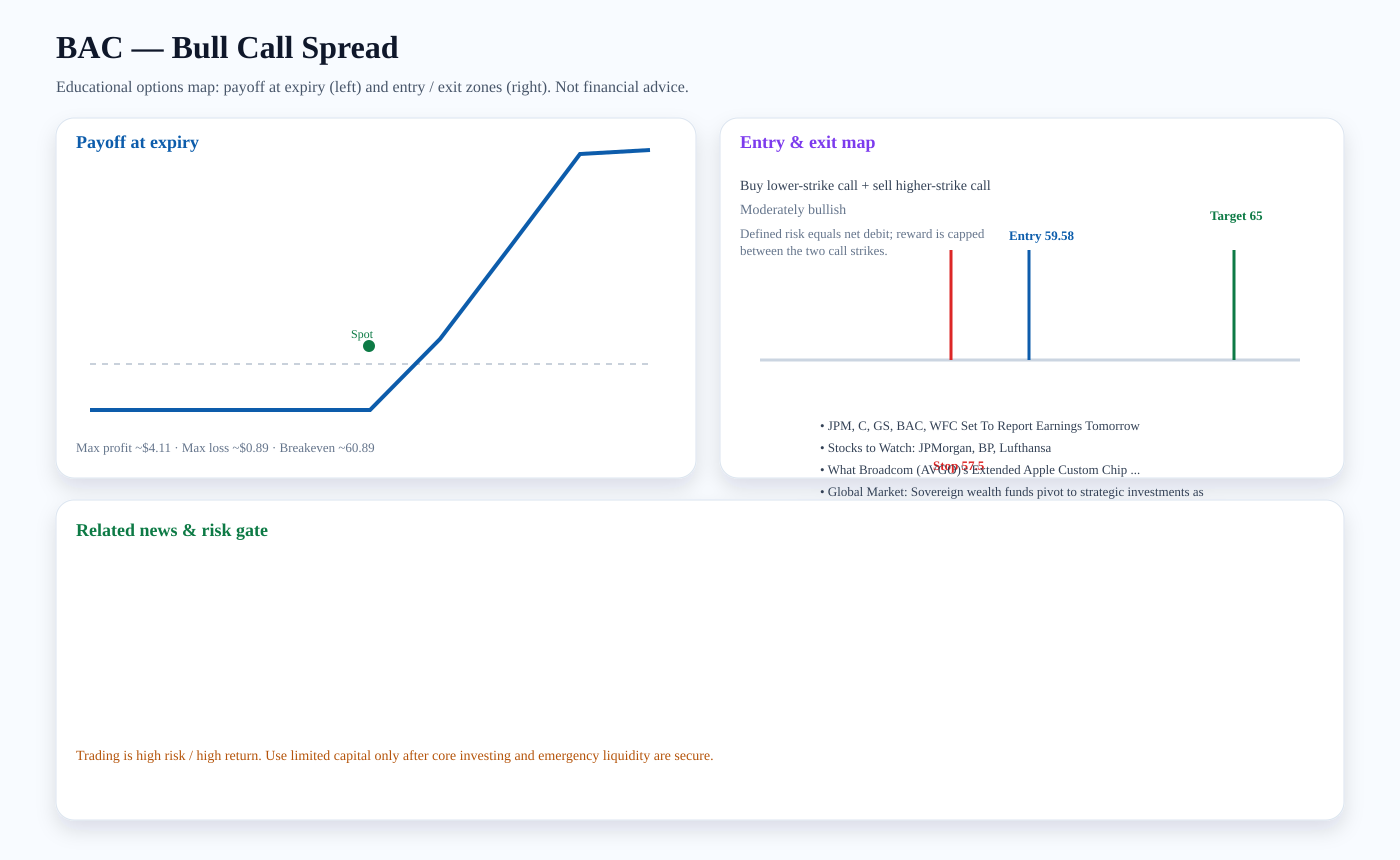
Structure: Buy lower-strike call + sell higher-strike call
Outlook: Moderately bullish
Entry zone: ~59.58 · Target: ~65 · Stop: ~57.5 · Breakeven: ~60.89
Risk note: Defined risk equals net debit; reward is capped between the two call strikes.
Related news links:
Payoff chart (Mermaid):
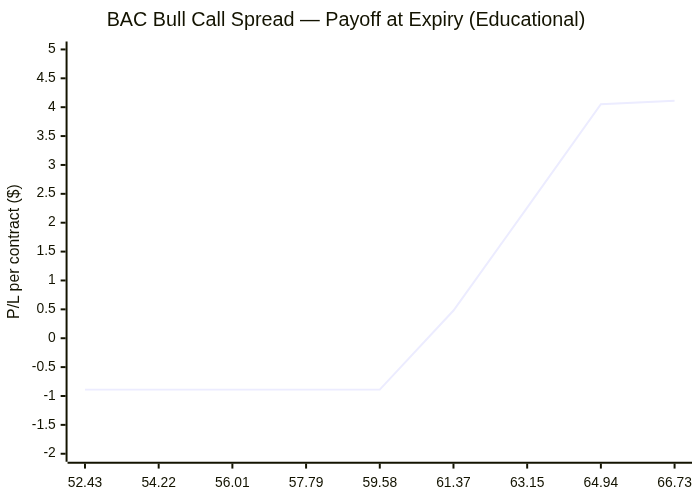
Entry / exit map (Mermaid):

Trading versus investing
Investing focuses on durable ownership, diversification, and compounding. Trading seeks faster tactical returns and carries higher risk. We treat options trading as limited-capital, educational analysis only after core investment capital and emergency liquidity are protected.
PDF report — Premium
Premium members get the full PDF attached to email briefs and can download it here. Upgrade for just $2 a month.
Subscribe for $2/month