
US Market Intelligence Brief
Report as-of (US/Eastern): 2026-07-16 09:04:55 EDT
Executive summary
Report as-of (US/Eastern): 2026-07-16 09:04:55 EDT
The US market is showing mixed signals with mega-cap tech leading both gains and losses. GOOG (+4.18%), MSFT (+3.71%), and UNH (+5.84%) are driving upside momentum, while semiconductor names face significant pressure with TSM (-4.26%), MU (-12.53%), and SNDK (-14.91%) posting sharp declines. The divergence suggests sector rotation within mega-caps rather than broad market weakness. AI infrastructure concerns and TSMC earnings impact are weighing on memory/semiconductor stocks despite strong fundamental outlooks.
Market regime check (S&P 500 + sector/thematic ETFs)
While direct S&P 500 data isn't provided, the mega-cap composition suggests a mixed but resilient market regime. The trending names represent significant S&P 500 weightings:
- Tech mega-caps diverging: GOOG/MSFT strength vs semiconductor weakness indicates sector rotation rather than broad tech selloff
- Healthcare leadership: UNH's +5.84% surge suggests defensive rotation gaining traction
- Industrial resilience: GE's modest -2.04% decline shows relative strength in cyclicals
- Semiconductor correction: TSM/MU/SNDK weakness reflects AI infrastructure build-out concerns and valuation reset
The pattern suggests a "quality rotation" regime where investors favor established revenue streams over speculative AI infrastructure plays.
Why these names are trending (search momentum + weekly/monthly price action)
Momentum leaders with fundamental support:
- GOOG: +3.21% weekly, +3.36% monthly – consistent uptrend with AI earnings catalyst ahead
- MSFT: +3.21% weekly, +1.25% monthly – Evercore price target hike driving institutional interest
- UNH: -1.66% weekly but +3.03% monthly – defensive rotation beneficiary with strong fundamentals
Correction candidates with oversold potential:
- TSM: -4.00% weekly, -1.05% monthly – Q2 earnings beat (+77% profit growth) vs stock weakness creating disconnect
- MU: -4.69% weekly, -7.86% monthly – AI infrastructure concerns pressuring memory demand outlook
- SNDK: -6.49% weekly, -18.44% monthly – severe technical breakdown suggesting fundamental issues
Key news drivers
- AI Infrastructure Debate: Headlines questioning whether AI build-out is a bubble are pressuring semiconductor stocks despite strong earnings (TSMC +77% profit growth)
- TSMC Earnings Disconnect: Strong Q2 results with 2026 outlook raised to 40% revenue growth, yet stock declining on broader sector concerns
- Google AI Test: Upcoming earnings seen as major test for Google Search revenue amid AI competition threats
- Microsoft Momentum: Evercore price target increase driving institutional buying interest
- Sector Rotation Signals: Healthcare (UNH) and established tech (GOOG/MSFT) outperforming speculative AI infrastructure plays
Durable momentum ideas (mid/high-cap focus)
Primary momentum candidates:
MSFT ($399.22, +3.71%): Most sustainable momentum given:
- Consistent weekly/monthly uptrends (+3.21%/+1.25%)
- Analyst support with recent price target increases
- Diversified AI exposure beyond infrastructure speculation
- Strong institutional ownership providing support
UNH ($450.00, +5.84%): Defensive momentum play:
- Healthcare sector rotation beneficiary
- Strong monthly trend (+3.03%) despite weekly weakness
- Recession-resistant business model
- Mega-cap liquidity with institutional support
GOOG ($372.26, +4.18%): Earnings catalyst momentum:
- Reasonable valuation (24.61x forward P/E vs 23.71x industry)
- AI concerns already reflected in price
- Search dominance remains intact per traffic data
- Strong weekly/monthly trends supporting technical breakout
Options / structure ideas
*This is educational analysis only and not financial advice. Options trading involves substantial risk.*
MSFT – Primary: CALL structures
- Call debit spread: 400/410 spread for 2026-07-24 expiry capturing continued momentum
- Put structure: Cash-secured puts at 390 level for entry on any pullback
- Rationale: Strongest momentum profile with analyst support
UNH – Primary: CALL structures
- Call debit spread: 450/460 targeting healthcare rotation continuation
- Put structure: Protective puts at 440 for existing positions
- Rationale: Defensive sector leadership with institutional buying
TSM – Primary: PUT structures
- Put debit spread: 400/390 capturing disconnect between earnings strength and price weakness
- Call structure: Covered calls at 410 if holding shares, collecting premium on volatility
- Rationale: Fundamental strength vs technical weakness creates opportunity
MU – Primary: PUT structures
- Put debit spread: 860/840 targeting continued semiconductor pressure
- Call structure: Wait for oversold bounce setup given -12.53% gap down
- Rationale: AI infrastructure concerns likely to persist near-term
Risks & watch-outs
Immediate risks:
- Options liquidity concerns: Many trending names showing 0.0 bid/ask spreads in pre-market, suggesting execution challenges
- Semiconductor reversal risk: Strong TSMC fundamentals could trigger sector-wide bounce
- AI narrative shift: Any positive AI infrastructure news could reverse semiconductor weakness quickly
Structural risks:
- Sector rotation sustainability: Healthcare/defensive rotation may be temporary if growth concerns ease
- Earnings catalyst risk: GOOG earnings could disappoint on AI competition concerns
- Macro sensitivity: Mega-cap concentration means individual stock moves have outsized market impact
Key levels to watch:
- MSFT: $395 support level critical for momentum continuation
- TSM: $400 level as potential bounce point given earnings strength
- GOOG: $370 pre-market level needs to hold for bullish thesis
Visual strategy maps
Payoff curves and entry/exit zones below are educational aids — not trade instructions. Confirm with your own chart, liquidity, and risk limits.
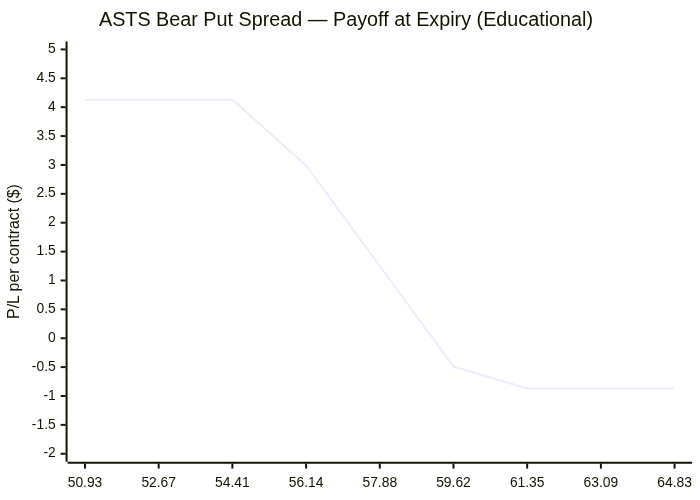
ASTS: Bear Put Spread
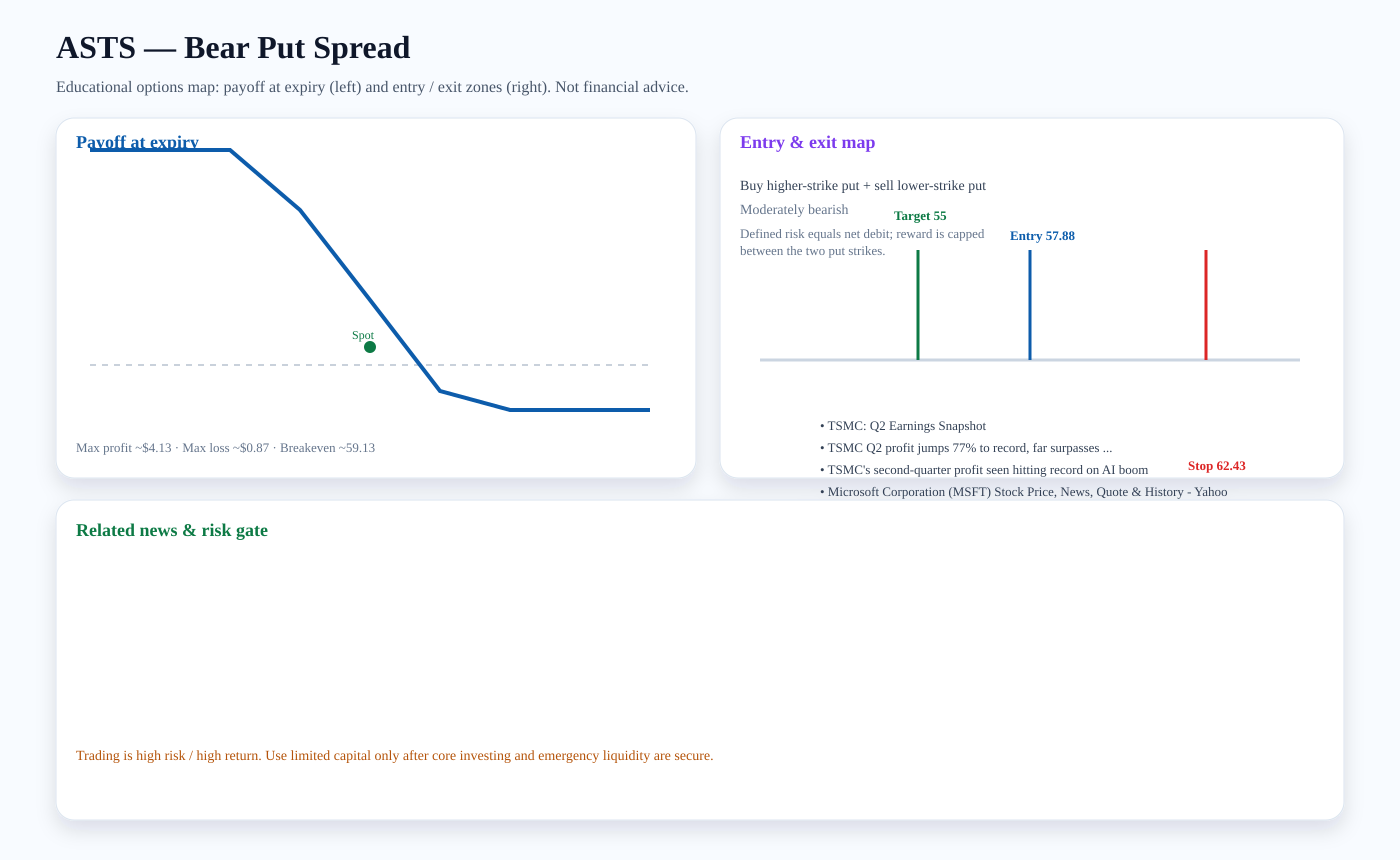
Structure: Buy higher-strike put + sell lower-strike put
Outlook: Moderately bearish
Entry zone: ~57.88 · Target: ~55 · Stop: ~62.43 · Breakeven: ~59.13
Risk note: Defined risk equals net debit; reward is capped between the two put strikes.
Related news links:
Payoff chart (Mermaid):
Entry / exit map (Mermaid):

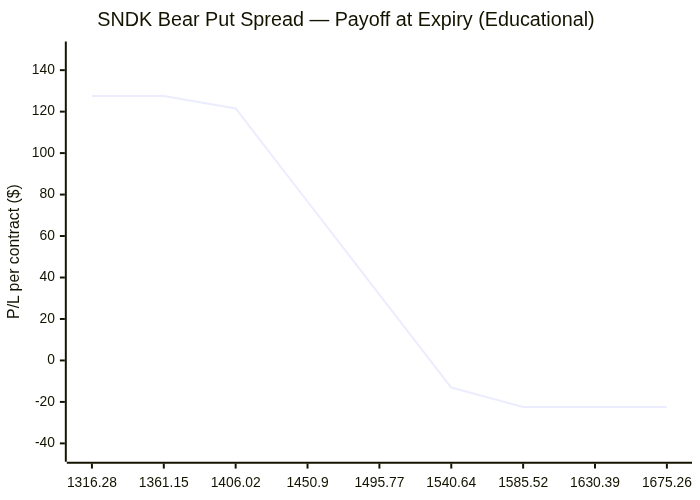
SNDK: Bear Put Spread
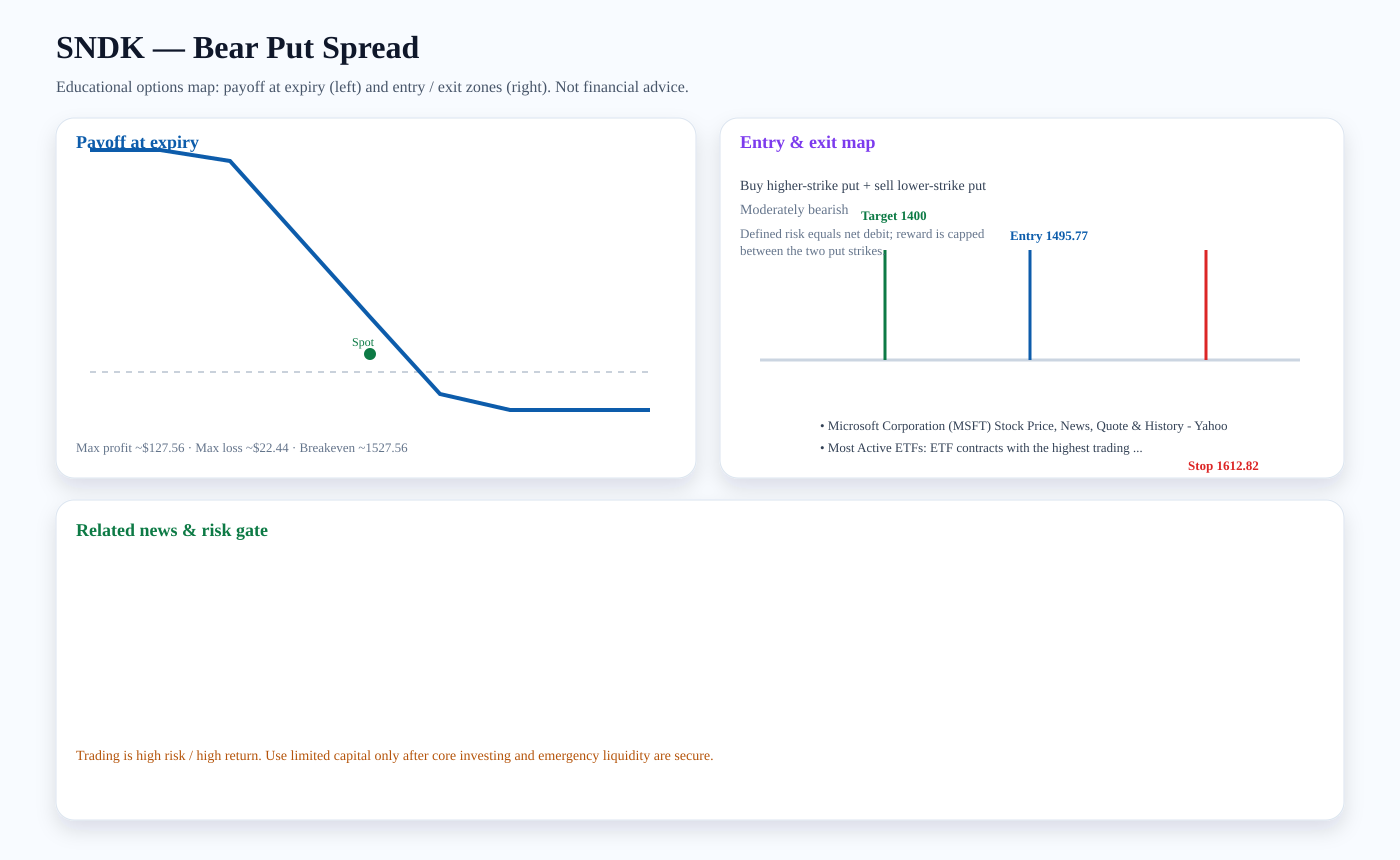
Structure: Buy higher-strike put + sell lower-strike put
Outlook: Moderately bearish
Entry zone: ~1495.77 · Target: ~1400 · Stop: ~1612.82 · Breakeven: ~1527.56
Risk note: Defined risk equals net debit; reward is capped between the two put strikes.
Related news links:
Payoff chart (Mermaid):
Entry / exit map (Mermaid):

MU: Bear Put Spread
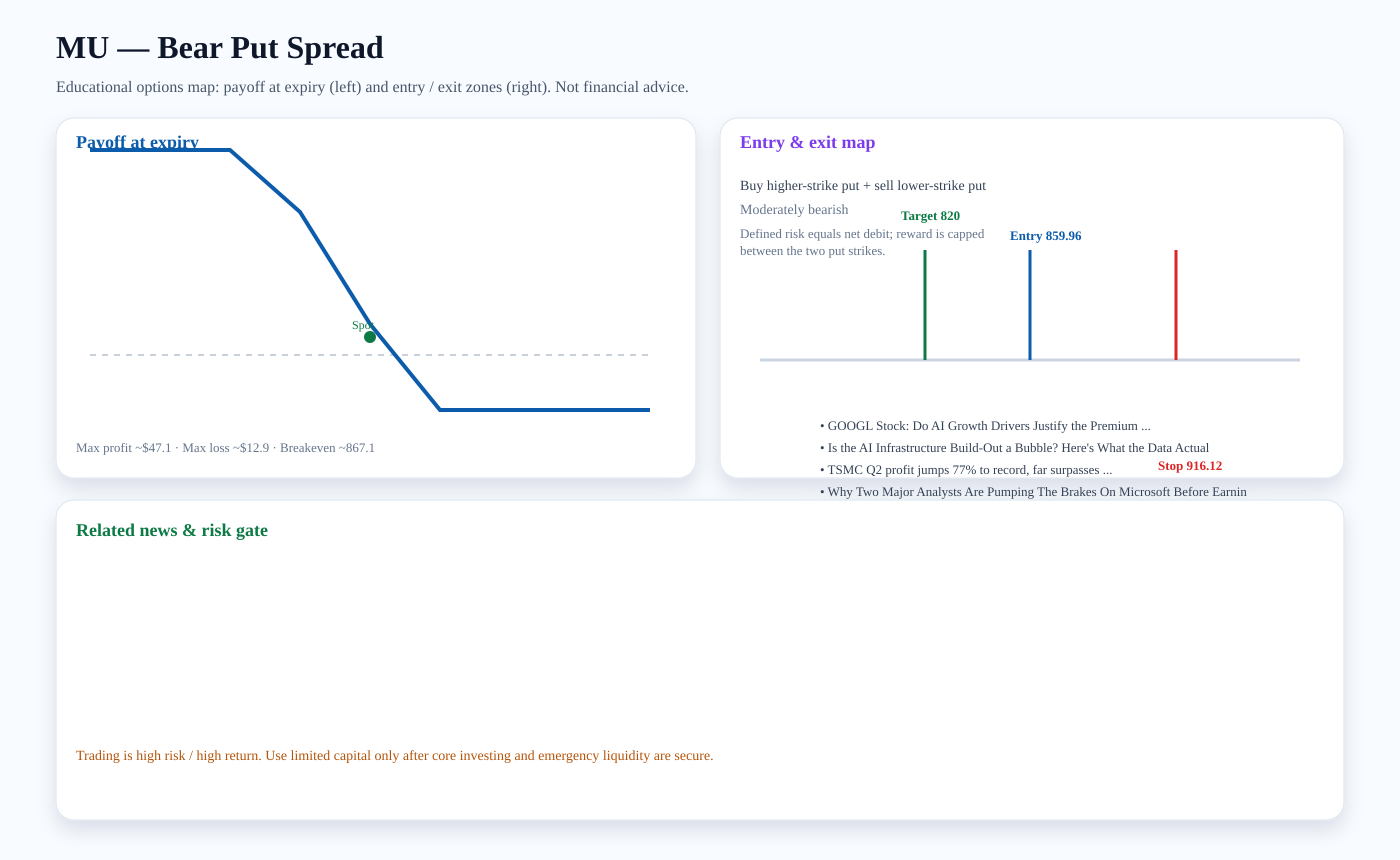
Structure: Buy higher-strike put + sell lower-strike put
Outlook: Moderately bearish
Entry zone: ~859.96 · Target: ~820 · Stop: ~916.12 · Breakeven: ~867.1
Risk note: Defined risk equals net debit; reward is capped between the two put strikes.
Related news links:
Payoff chart (Mermaid):
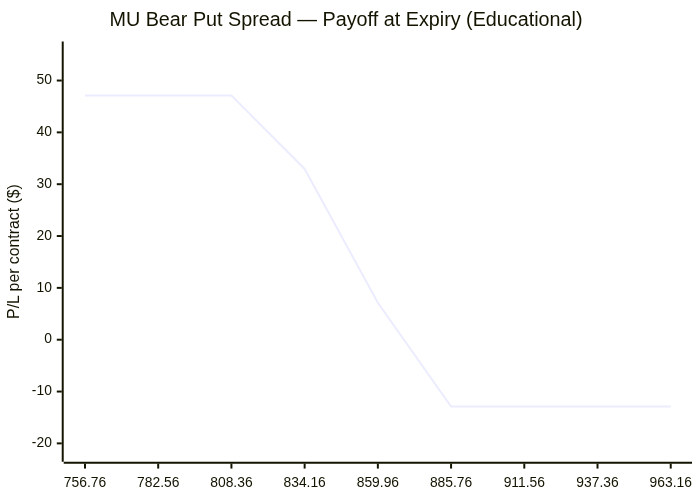
Entry / exit map (Mermaid):

GE: Bear Put Spread
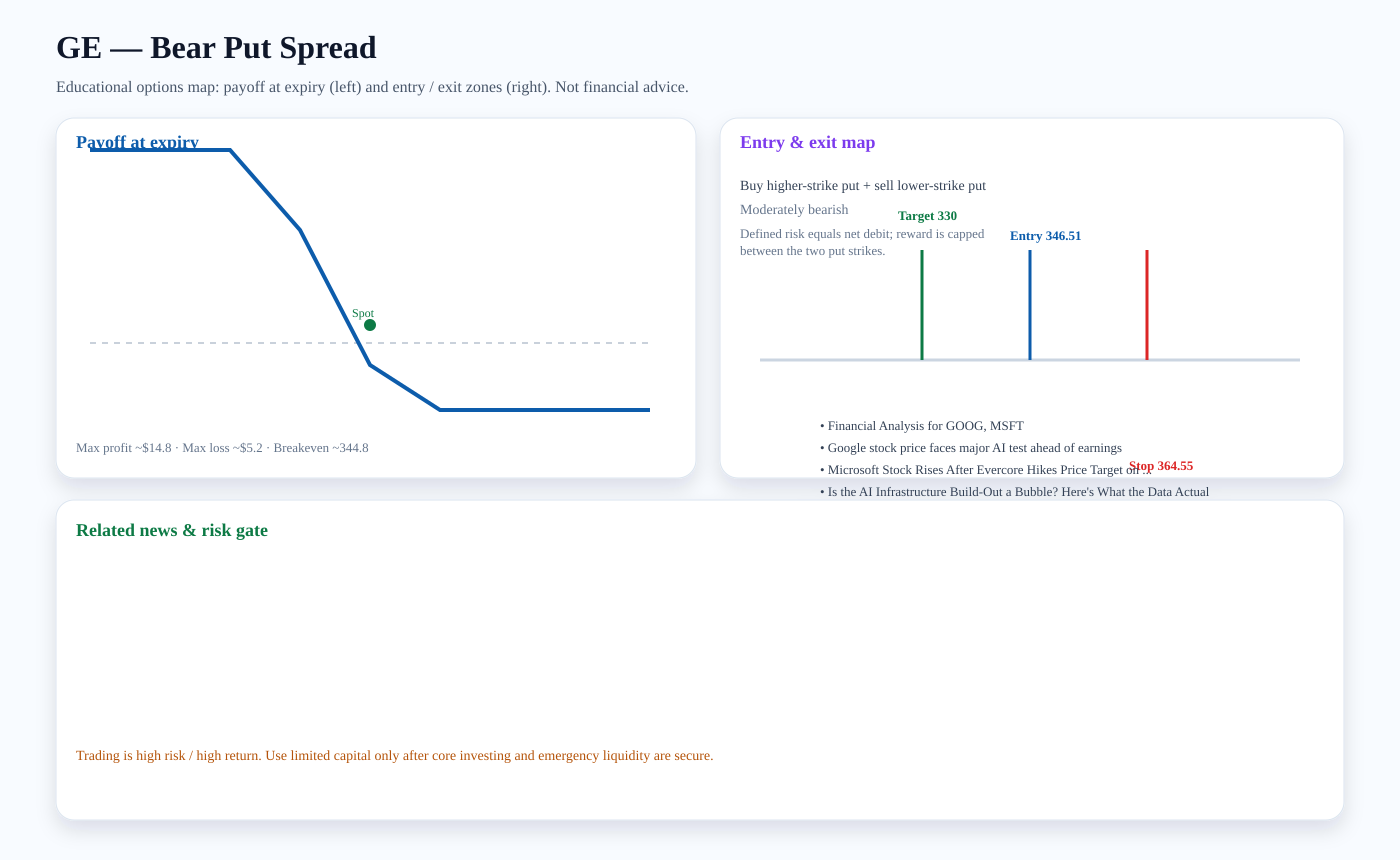
Structure: Buy higher-strike put + sell lower-strike put
Outlook: Moderately bearish
Entry zone: ~346.51 · Target: ~330 · Stop: ~364.55 · Breakeven: ~344.8
Risk note: Defined risk equals net debit; reward is capped between the two put strikes.
Related news links:
Payoff chart (Mermaid):
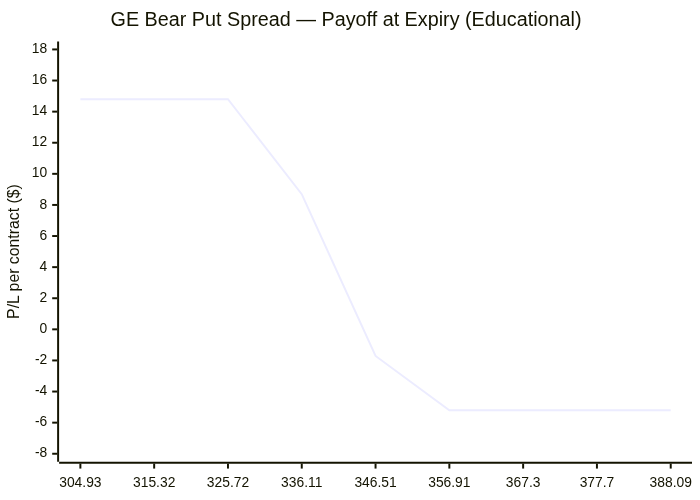
Entry / exit map (Mermaid):

Trading versus investing
Investing focuses on durable ownership, diversification, and compounding. Trading seeks faster tactical returns and carries higher risk. We treat options trading as limited-capital, educational analysis only after core investment capital and emergency liquidity are protected.
PDF report — Premium
Premium members get the full PDF attached to email briefs and can download it here. Upgrade for just $2 a month.
Subscribe for $2/month