
US Market Intelligence Brief
Report as-of (US/Eastern): 2026-07-16 09:32:16 EDT
Executive summary
Report as-of (US/Eastern): 2026-07-16 09:32:16 EDT
US markets show mixed action with healthcare and tech megacaps dominating trending activity. UnitedHealth Group leads with an exceptional +8.2% gap-up on analyst upgrades, while Abbott Laboratories surges +6.7% in the healthcare rally. Semiconductor names face headwinds despite TSMC's record Q2 AI profits, with memory stocks MU and SNDK declining sharply. The divergence between fundamental AI chip demand and stock performance suggests profit-taking or valuation concerns in the semiconductor complex.
Market regime check (S&P 500 + sector/thematic ETFs)
Market showing sector rotation with healthcare outperforming while semiconductors lag despite strong fundamentals. The trending names suggest a "quality at reasonable price" regime favoring established healthcare giants over high-multiple tech plays. Taiwan Semiconductor's -1.67% decline despite record profits indicates markets may be pricing in peak AI chip demand or geopolitical risks. Memory sector weakness (MU -3.03%, SNDK -4.36%) points to cyclical concerns overshadowing AI infrastructure buildout themes.
Why these names are trending (search momentum + weekly/monthly price action)
Healthcare momentum: UNH (+5.0% weekly, +10.27% monthly) and ABT (+1.73% weekly, +8.31% monthly) showing sustained institutional accumulation ahead of earnings season.
Semiconductor divergence: TSM trending on record earnings but declining (-5.62% weekly, -6.57% monthly), while MU (-11.54% weekly, -19.36% monthly) and SNDK (-16.88% weekly, -26.72% monthly) face severe selling pressure.
Megacap stability: MSFT and GOOG showing resilience with modest moves (+2.71%/+4.75% weekly respectively) while maintaining search interest.
Key news drivers
- TSMC record Q2 profits: AI demand driving higher revenue and investment outlook, but stock declining suggests "buy the rumor, sell the news" dynamic
- UnitedHealth analyst upgrades: Fair value estimates raised to $424.23 from $411.31, providing fundamental support for the +8.2% gap-up
- AI infrastructure concerns: Reports of potential "Lehman Brothers of AI bubble" creating uncertainty around semiconductor valuations
- Memory sector headwinds: Cyclical downturn concerns overshadowing AI data center demand for memory chips
Durable momentum ideas (mid/high-cap focus)
UNH (Primary bullish): Analyst upgrade cycle supporting $450+ levels with defensive healthcare positioning into potential economic uncertainty. Monthly +10.27% trend backed by fundamental re-rating.
ABT (Secondary bullish): Medical device/diagnostics leader benefiting from healthcare spending normalization. +6.7% daily move on lower volume suggests institutional accumulation rather than retail speculation.
TSM (Contrarian opportunity): Record AI profits at -6.57% monthly decline creates potential value entry for patient capital. Geopolitical risks priced in, AI infrastructure demand remains structural.
GOOG (Defensive growth): +4.75% weekly with modest daily volatility suggests steady institutional interest in AI/cloud infrastructure plays at reasonable valuations.
Options / structure ideas
*Educational analysis only – not financial advice*
UNH (Primary: CALL)
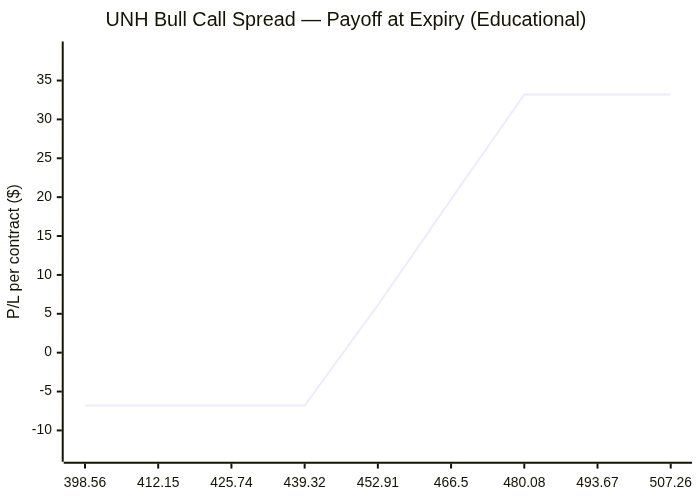
- Call structure: 452.5/460 debit spread (2026-07-24) to capture momentum continuation
- Put structure: Cash-secured puts at 440-445 for pullback entries
- Rationale: Analyst upgrades + gap-up momentum with healthcare defensive appeal
TSM (Primary: PUT)
- Put structure: 412.5/405 debit spread targeting continued weakness despite strong fundamentals
- Call structure: 412.5/420 debit spread for contrarian bounce play on oversold conditions
- Rationale: Negative momentum overriding positive earnings surprise
MU (Primary: PUT)
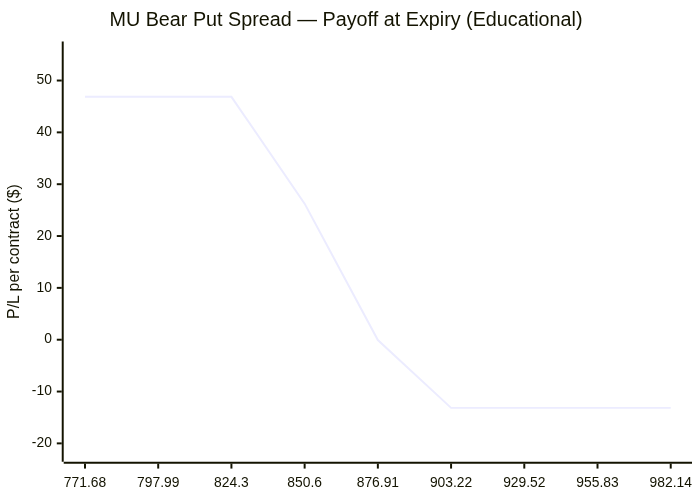
- Put structure: 875/850 debit spread on memory sector cyclical decline
- Call structure: Covered calls at 900-925 strikes for income on existing positions
- Rationale: -19.36% monthly decline suggests sustained sector rotation
Liquidity warning: Multiple names showing $0.00 bid/ask spreads in options chains – verify live pricing and expect wide spreads on execution.
Risks & watch-outs
Execution risks: Poor options liquidity across trending names with zero bid/ask spreads requiring careful order management and potential slippage.
Sector rotation velocity: Healthcare rally may be short-term defensive positioning rather than sustained outperformance if growth concerns ease.
Semiconductor valuation floor: Memory and chip stocks may be oversold with AI infrastructure demand providing fundamental support at lower levels.
Geopolitical overhang: Taiwan Semiconductor faces ongoing China/Taiwan tensions that could override strong fundamentals.
Earnings season volatility: Healthcare names approaching earnings with elevated expectations following analyst upgrades, creating potential disappointment risk.
Visual strategy maps
Payoff curves and entry/exit zones below are educational aids — not trade instructions. Confirm with your own chart, liquidity, and risk limits.
ASTS: Bear Put Spread
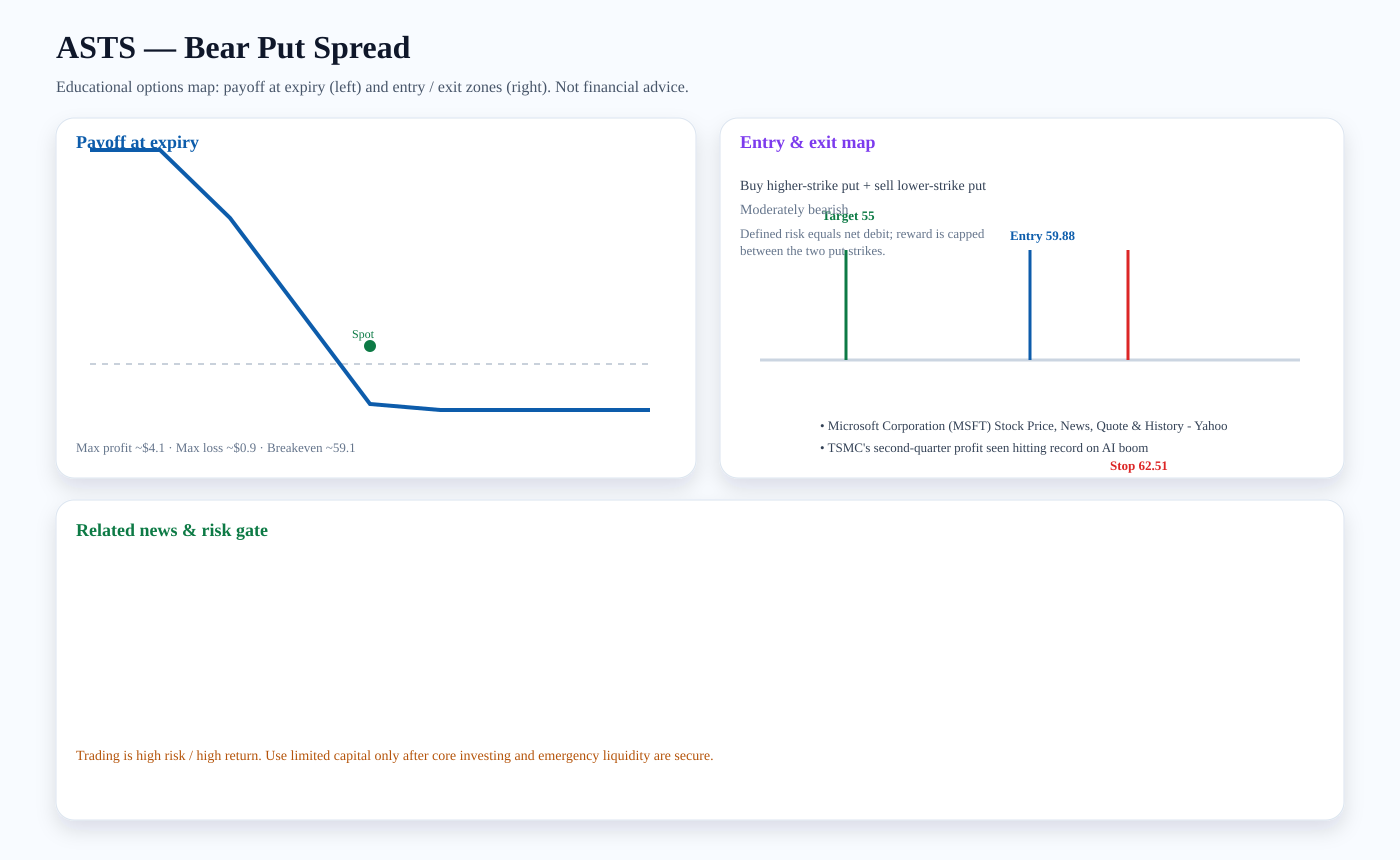
Structure: Buy higher-strike put + sell lower-strike put
Outlook: Moderately bearish
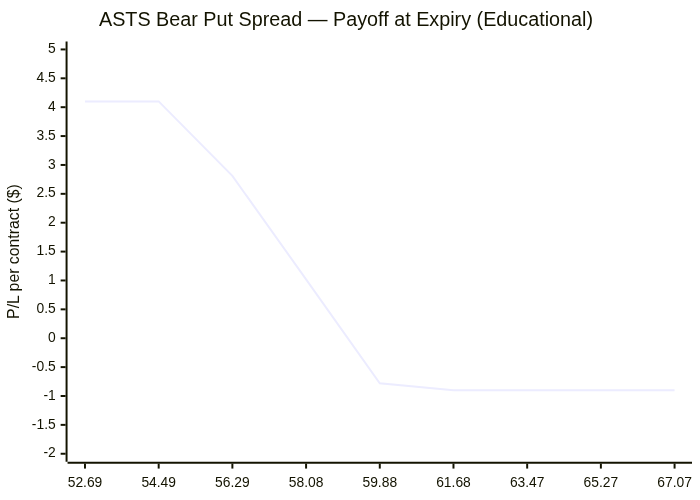
Entry zone: ~59.88 · Target: ~55 · Stop: ~62.51 · Breakeven: ~59.1
Risk note: Defined risk equals net debit; reward is capped between the two put strikes.
Related news links:
Payoff chart (Mermaid):
Entry / exit map (Mermaid):

SNDK: Bear Put Spread
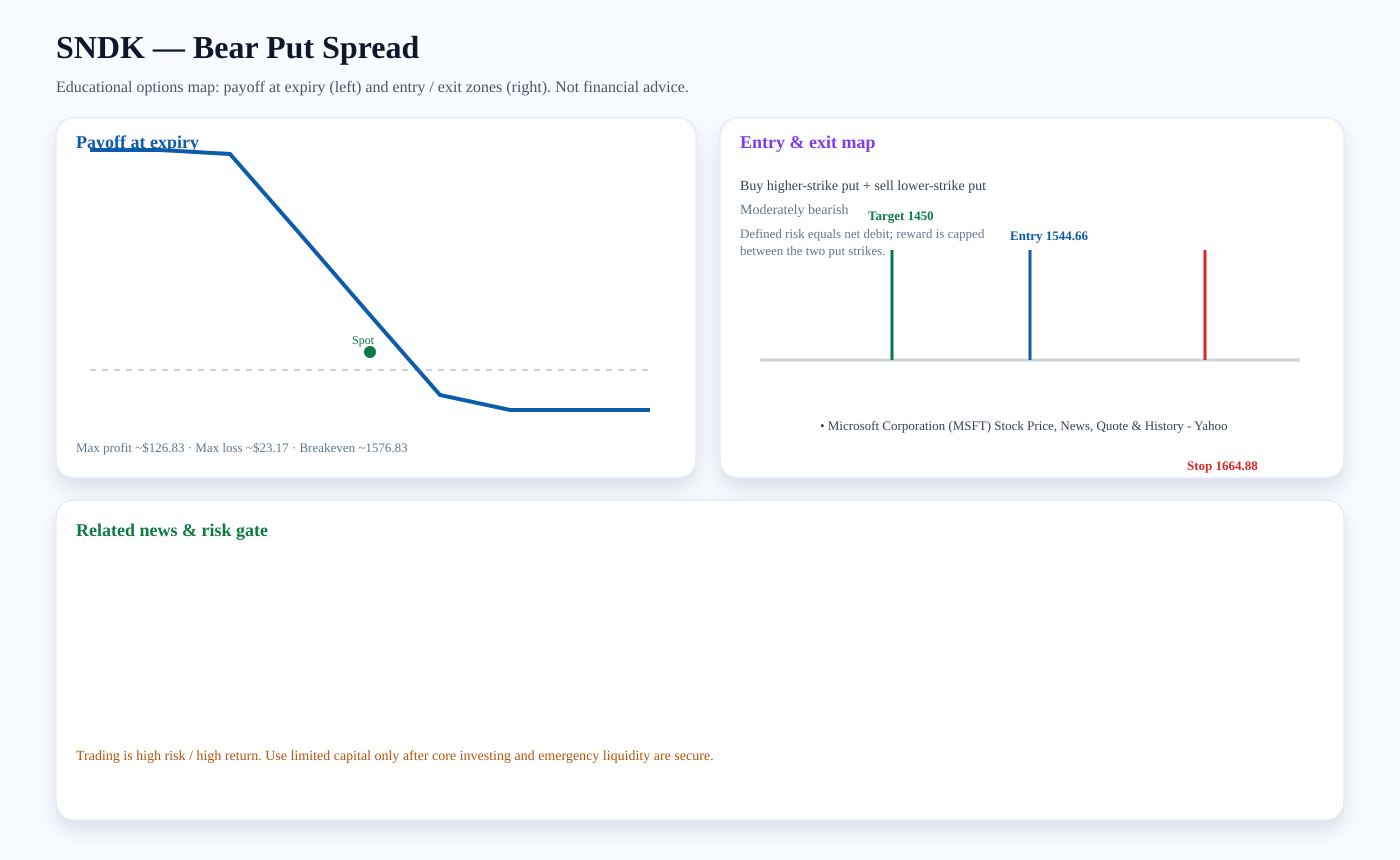
Structure: Buy higher-strike put + sell lower-strike put
Outlook: Moderately bearish
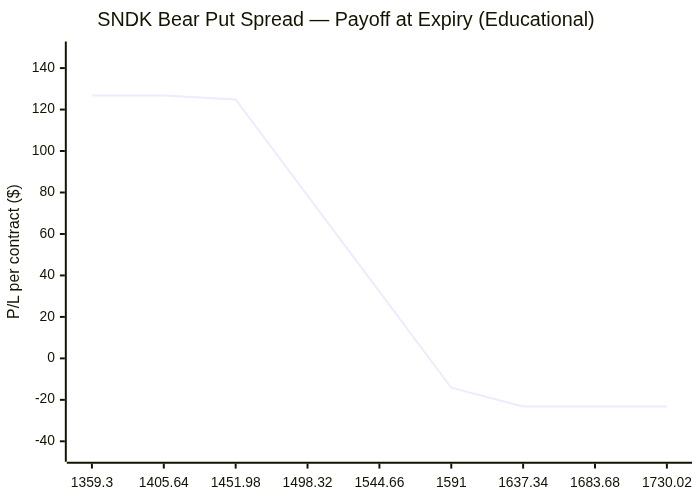
Entry zone: ~1544.66 · Target: ~1450 · Stop: ~1664.88 · Breakeven: ~1576.83
Risk note: Defined risk equals net debit; reward is capped between the two put strikes.
Related news links:
Payoff chart (Mermaid):
Entry / exit map (Mermaid):

MU: Bear Put Spread
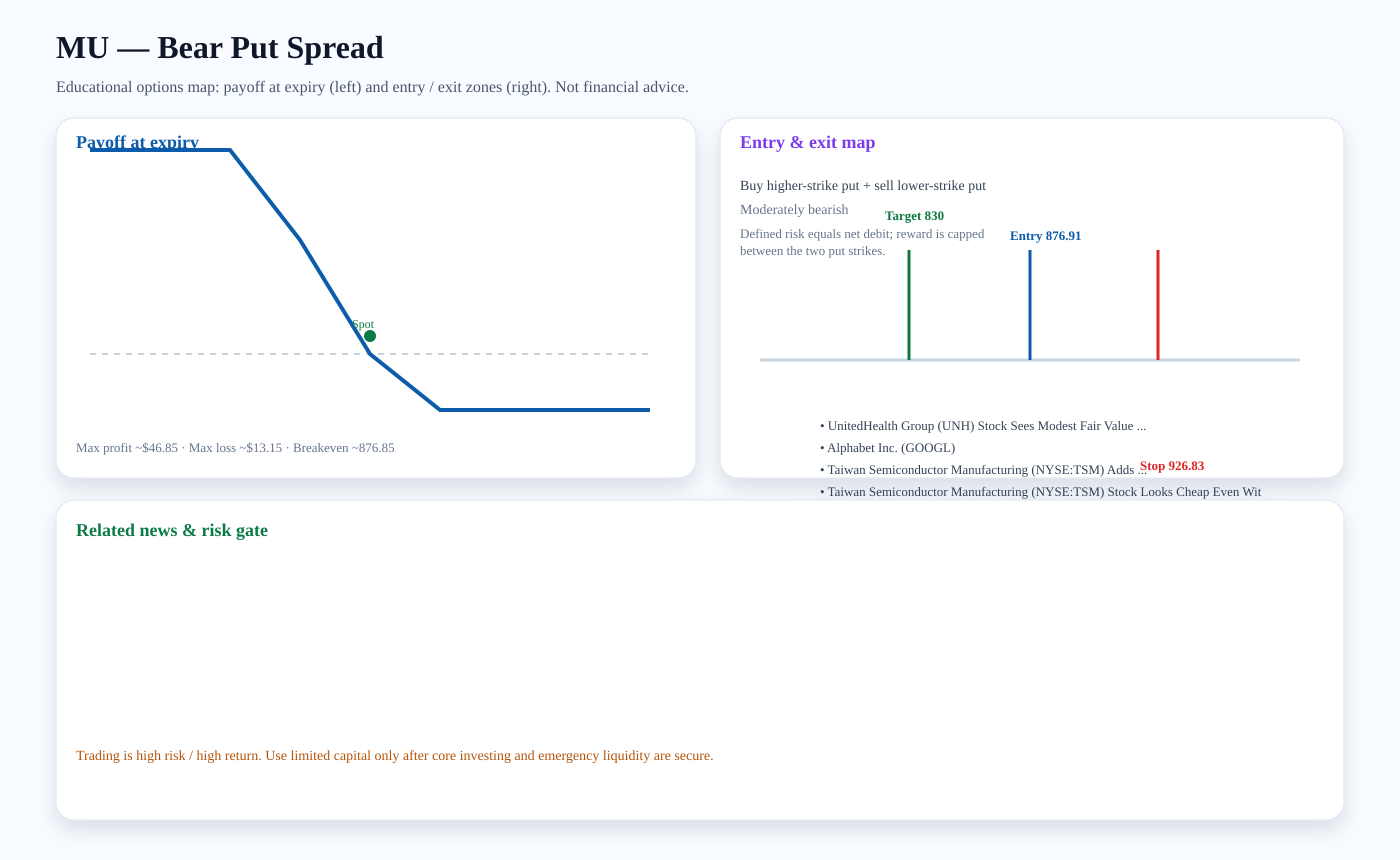
Structure: Buy higher-strike put + sell lower-strike put
Outlook: Moderately bearish
Entry zone: ~876.91 · Target: ~830 · Stop: ~926.83 · Breakeven: ~876.85
Risk note: Defined risk equals net debit; reward is capped between the two put strikes.
Related news links:
Payoff chart (Mermaid):
Entry / exit map (Mermaid):

UNH: Bull Call Spread
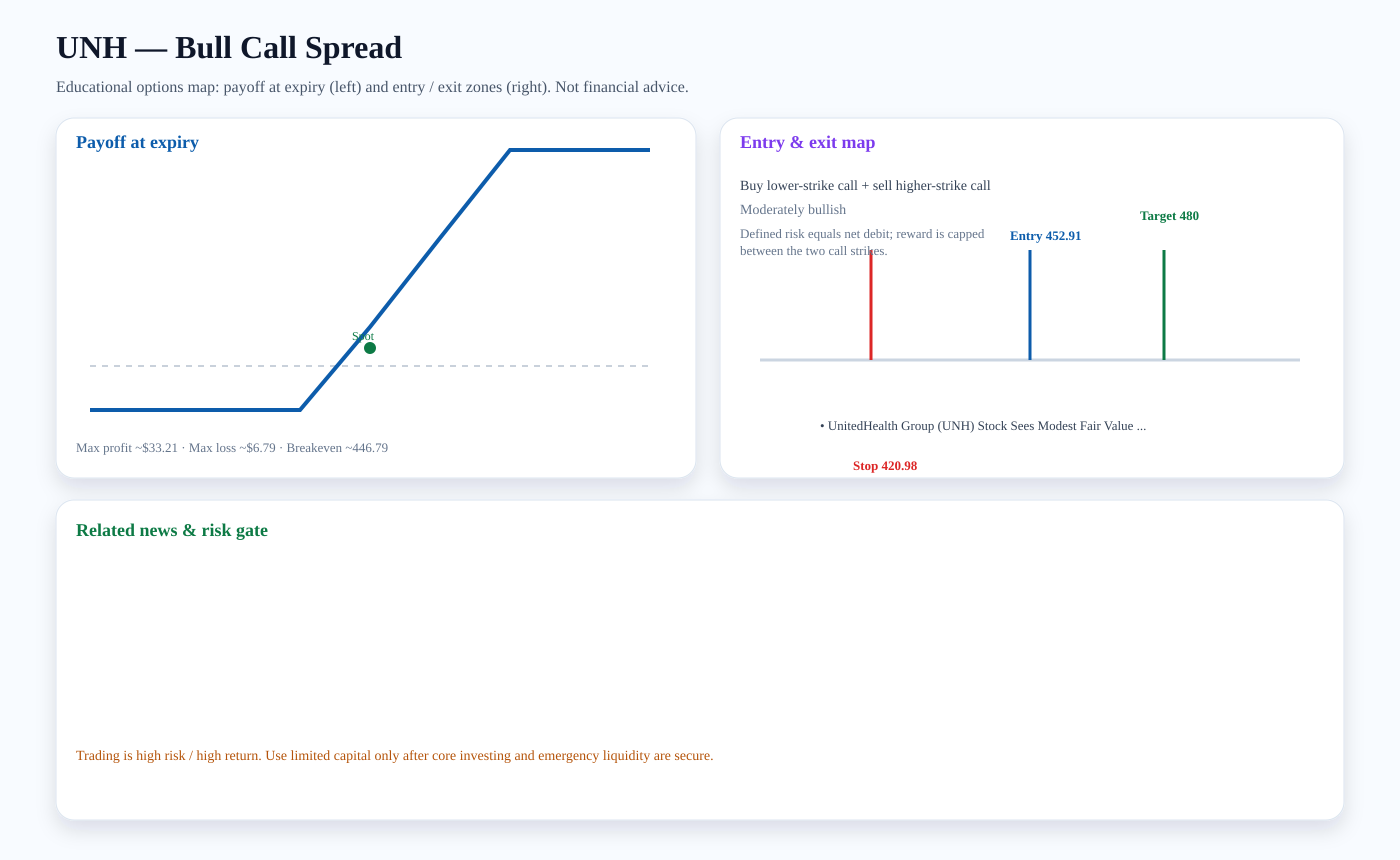
Structure: Buy lower-strike call + sell higher-strike call
Outlook: Moderately bullish
Entry zone: ~452.91 · Target: ~480 · Stop: ~420.98 · Breakeven: ~446.79
Risk note: Defined risk equals net debit; reward is capped between the two call strikes.
Related news links:
Payoff chart (Mermaid):
Entry / exit map (Mermaid):

Trading versus investing
Investing focuses on durable ownership, diversification, and compounding. Trading seeks faster tactical returns and carries higher risk. We treat options trading as limited-capital, educational analysis only after core investment capital and emergency liquidity are protected.
PDF report — Premium
Premium members get the full PDF attached to email briefs and can download it here. Upgrade for just $2 a month.
Subscribe for $2/month