
US Market Intelligence Brief
Report as-of (US/Eastern): 2026-07-17 09:05:27 EDT
Executive summary
Report as-of (US/Eastern): 2026-07-17 09:05:27 EDT
The US market is experiencing significant volatility with mixed sector performance. Technology faces continued pressure with Netflix (NFLX) down -10.83% despite beating Q2 earnings, while semiconductor weakness persists. Financials show resilience with regional banks FITB (+0.67%) and TFC maintaining strong monthly momentum (+12.81% and +9.84% respectively). Insurance leader TRV (+2.43%) continues its upward trajectory. Medical technology faces headwinds with ISRG down -6.21% post-earnings despite beating estimates. Space/technology SPCX shows severe weakness (-7.10% pre-market, -31.89% monthly).
Market regime check (S&P 500 + sector/thematic ETFs)
Semiconductor sector under pressure: News indicates broad-based semiconductor sell-off with the iShares Semiconductor ETF (SOXX) heading for its worst weekly performance. Major chip names including MU (-4.4%), SNDK (-6%), INTC, and AMD extending declines, suggesting sector-wide rotation or fundamental concerns.
Technology rotation continues: The semiconductor weakness combined with Netflix's post-earnings decline despite beating estimates indicates investors are rotating away from high-multiple technology names, potentially favoring value sectors.
Financials showing relative strength: Regional banks demonstrating resilience with strong monthly trends, suggesting the sector may be benefiting from interest rate environment expectations or improved credit conditions.
Why these names are trending (search momentum + weekly/monthly price action)
Earnings-driven volatility: NFLX and ISRG both reported Q2 results, creating significant price action despite beating estimates. This suggests forward guidance or growth concerns are weighing on investor sentiment.
Financial sector momentum: FITB (+5.01% weekly, +12.81% monthly) and TFC (+3.66% weekly, +9.84% monthly) trending due to sustained outperformance in the regional banking space, with dividend coverage becoming a key investor focus.
Sector rotation dynamics: The trending names reflect a clear rotation from growth/technology (NFLX, ISRG, SPCX all declining) toward value/financials (FITB, TFC, TRV gaining), indicating potential regime shift in market leadership.
Key news drivers
Technology earnings disappointment: Netflix's -10.83% decline despite beating Q2 EPS estimates ($0.80 vs $0.79 expected) suggests guidance or subscriber metrics disappointed investors. Revenue of $12.56B narrowly missed expectations.
Medical technology headwinds: Intuitive Surgical fell despite better-than-expected Q2 results, indicating sector-specific concerns or valuation compression in medical device names.
Semiconductor sector pressure: Broad-based chip sell-off with geopolitical tensions between US and Iran adding to sector concerns, creating systematic risk across technology hardware names.
Financial sector strength: Truist Financial highlighted as among "Best Financial Sector Dividend Stocks," supporting the narrative of quality regional bank outperformance.
Durable momentum ideas (mid/high-cap focus)
TRV (The Travelers Companies): Strong monthly momentum (+10.23%) with insurance sector benefiting from rate environment. Large-cap stability with $337 price level suggesting institutional accumulation. Momentum may sustain through continued rate normalization and strong underwriting cycles.
FITB (Fifth Third Bancorp): Exceptional monthly performance (+12.81%) in regional banking with dividend focus driving institutional interest. Quality regional bank exposure with strong credit metrics likely supporting continued outperformance versus sector peers.
TFC (Truist Financial): Solid monthly trend (+9.84%) with dividend sustainability narrative. Large regional bank scale provides defensive characteristics while maintaining growth optionality in improving credit environment.
Options / structure ideas
*This is educational content and not financial advice. Verify current bid/ask spreads before trading.*
Primary bullish structures (TRV, FITB, TFC): Call debit spreads using August 2026 expiration to capture continued financial sector momentum. TRV 340/350 call spread, FITB 60/65 call spread, TFC 52.5/55 call spread offer defined risk exposure to upside continuation.
Primary bearish structures (NFLX, SPCX): Put debit spreads for July 24 expiration on technology weakness. NFLX 66/62 put spread capitalizes on post-earnings decline, while SPCX 126/120 put spread targets continued space/tech sector pressure.
Liquidity warning: Multiple names showing $0.00 bid/ask spreads in snapshot data, indicating stale quotes or wide spreads requiring careful order management and live verification before execution.
Risks & watch-outs
Options liquidity concerns: Widespread $0.00 bid/ask spreads across trending names suggest poor liquidity or data lag, creating execution risk and potentially wide spreads that could erode strategy profitability.
Sector rotation volatility: Sharp moves in both directions as markets navigate technology weakness and financial strength could create whipsaw conditions, particularly dangerous for short-dated options strategies.
Earnings season uncertainty: With major banks (JPM, BAC, C, GS) reporting and technology names showing post-earnings volatility, implied volatility remains elevated, increasing options premium costs.
Geopolitical overhang: US-Iran tensions mentioned in semiconductor context could create systematic risk across technology hardware and defense-related names, potentially disrupting sector rotation themes.
Interest rate sensitivity: Financial sector momentum depends on rate environment expectations, while technology weakness may be rate-related, creating macro dependency for all trending themes.
Visual strategy maps
Payoff curves and entry/exit zones below are educational aids — not trade instructions. Confirm with your own chart, liquidity, and risk limits.
SPCX: Bear Put Spread
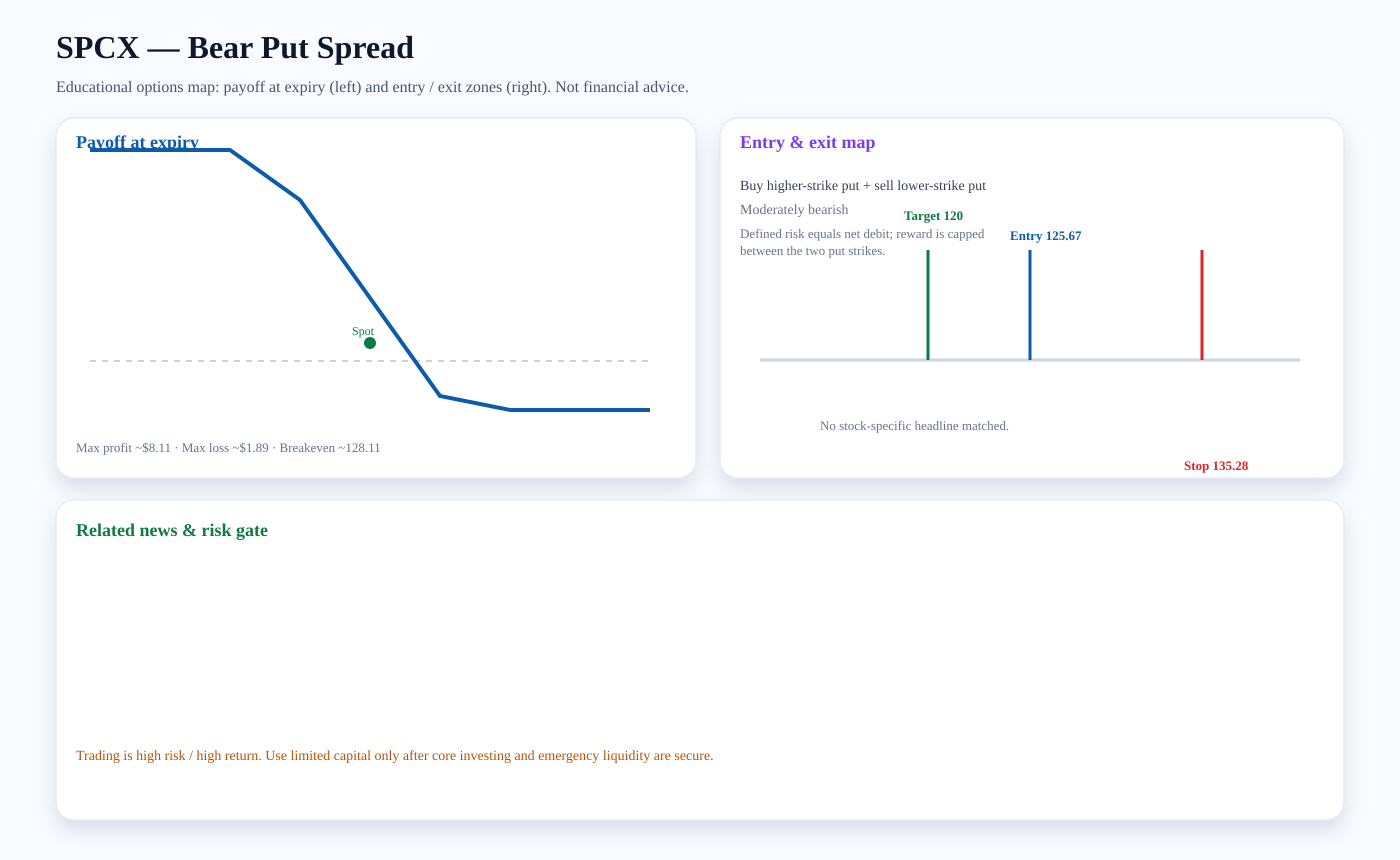
Structure: Buy higher-strike put + sell lower-strike put
Outlook: Moderately bearish
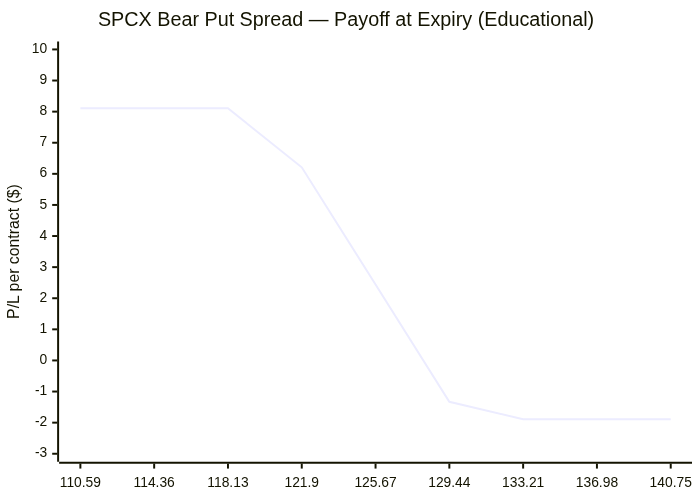
Entry zone: ~125.67 · Target: ~120 · Stop: ~135.28 · Breakeven: ~128.11
Risk note: Defined risk equals net debit; reward is capped between the two put strikes.
Payoff chart (Mermaid):
Entry / exit map (Mermaid):

NFLX: Bear Put Spread
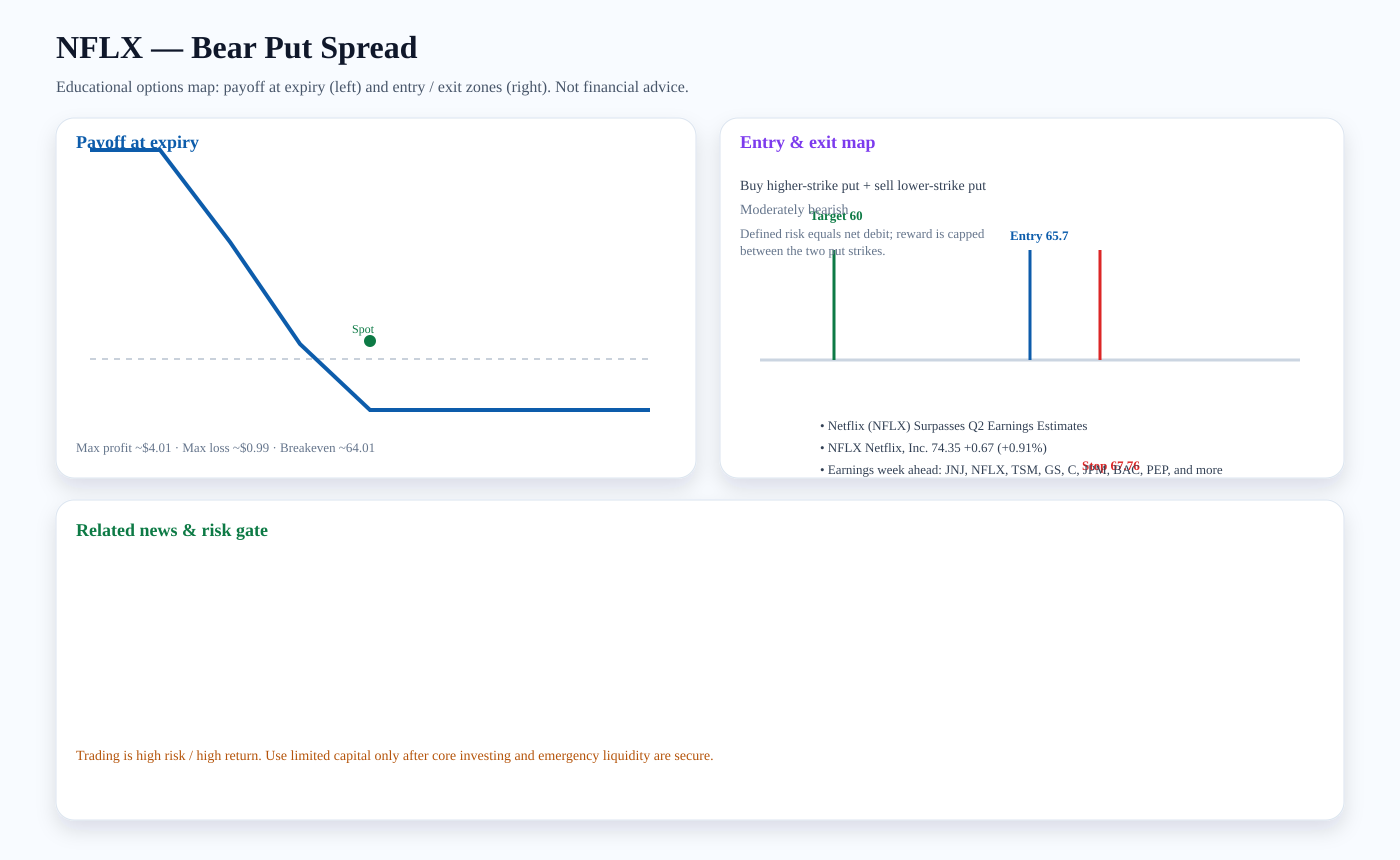
Structure: Buy higher-strike put + sell lower-strike put
Outlook: Moderately bearish
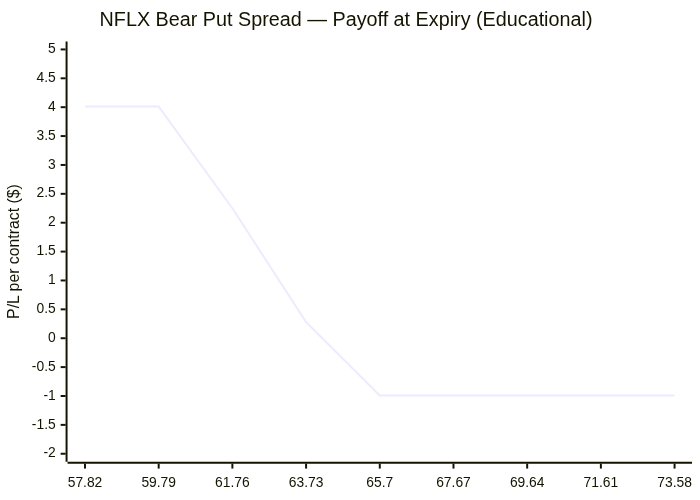
Entry zone: ~65.7 · Target: ~60 · Stop: ~67.76 · Breakeven: ~64.01
Risk note: Defined risk equals net debit; reward is capped between the two put strikes.
Related news links:
Payoff chart (Mermaid):
Entry / exit map (Mermaid):

FITB: Bull Call Spread
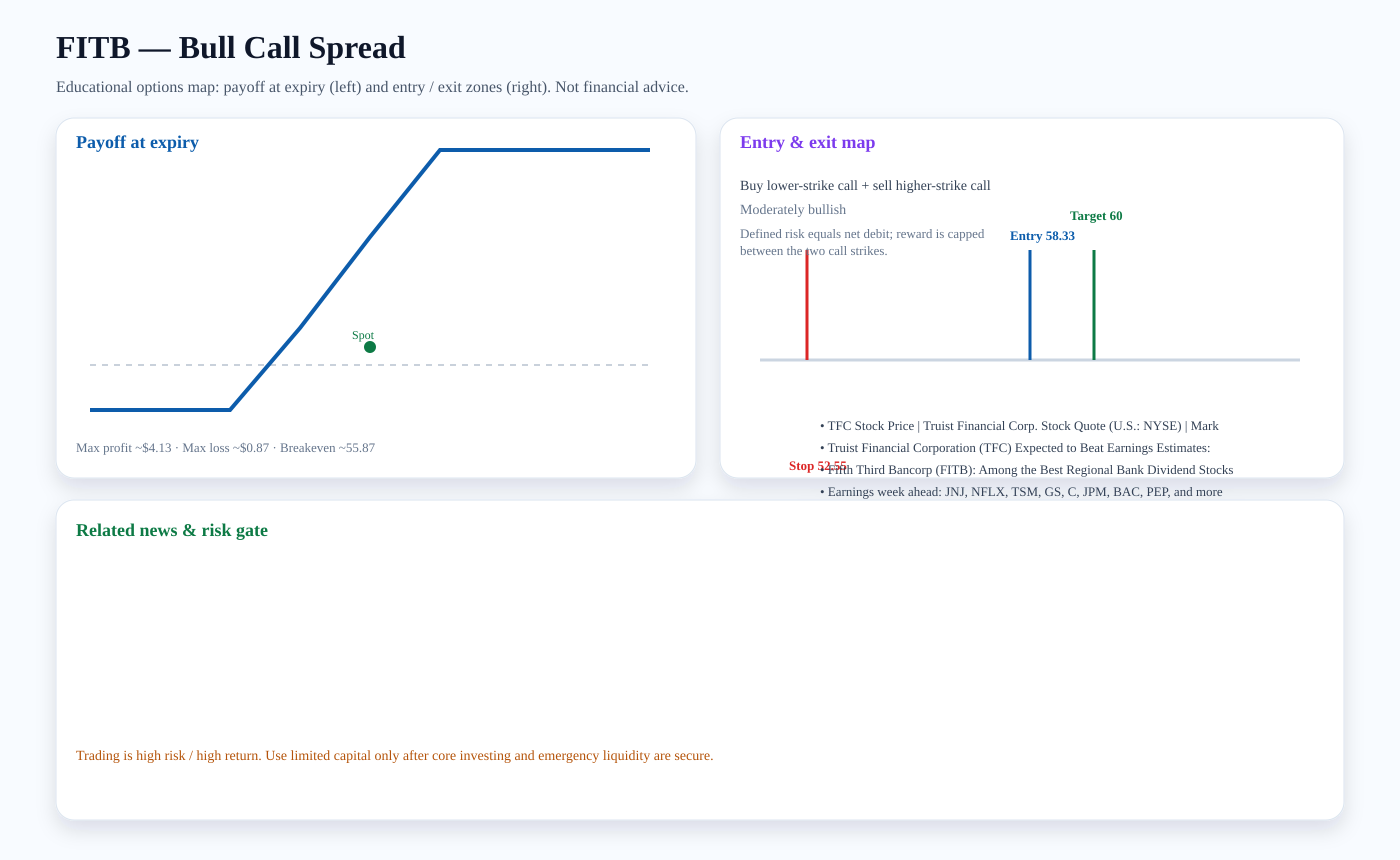
Structure: Buy lower-strike call + sell higher-strike call
Outlook: Moderately bullish
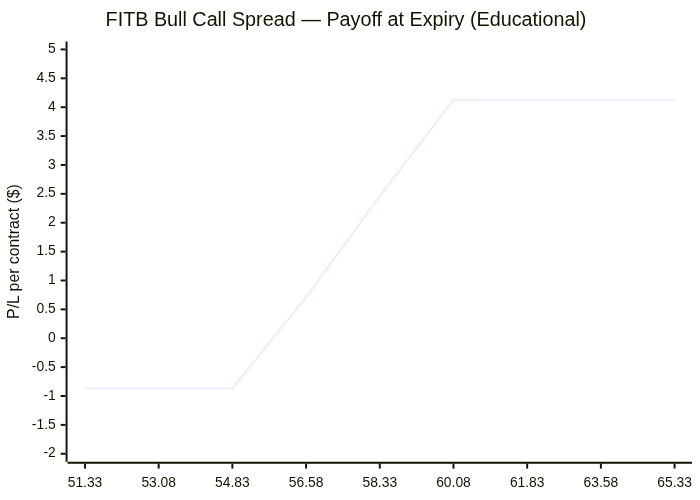
Entry zone: ~58.33 · Target: ~60 · Stop: ~52.55 · Breakeven: ~55.87
Risk note: Defined risk equals net debit; reward is capped between the two call strikes.
Related news links:
Payoff chart (Mermaid):
Entry / exit map (Mermaid):

TFC: Bull Call Spread
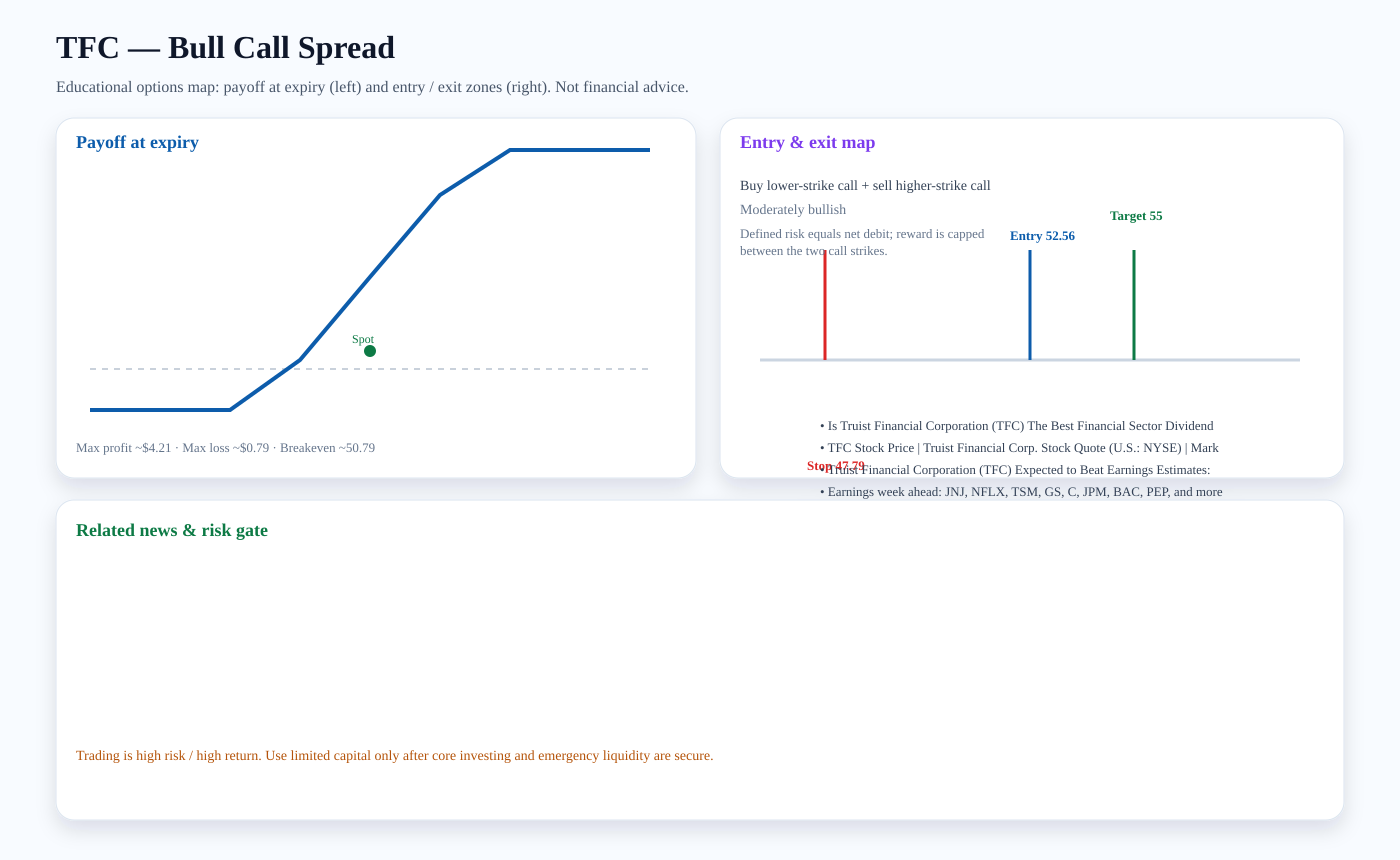
Structure: Buy lower-strike call + sell higher-strike call
Outlook: Moderately bullish
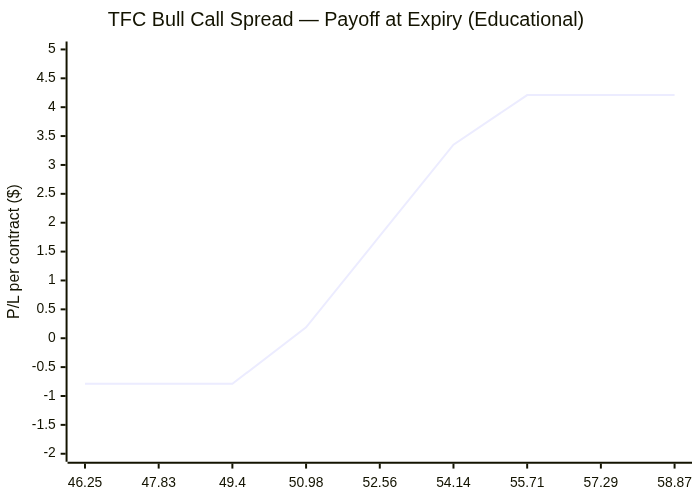
Entry zone: ~52.56 · Target: ~55 · Stop: ~47.79 · Breakeven: ~50.79
Risk note: Defined risk equals net debit; reward is capped between the two call strikes.
Related news links:
Payoff chart (Mermaid):
Entry / exit map (Mermaid):

Trading versus investing
Investing focuses on durable ownership, diversification, and compounding. Trading seeks faster tactical returns and carries higher risk. We treat options trading as limited-capital, educational analysis only after core investment capital and emergency liquidity are protected.
PDF report — Premium
Premium members get the full PDF attached to email briefs and can download it here. Upgrade for just $2 a month.
Subscribe for $2/month