
US Market Intelligence Brief
Report as-of (US/Eastern): 2026-07-17 09:31:52 EDT
Executive summary
Report as-of (US/Eastern): 2026-07-17 09:31:52 EDT
The US market is experiencing significant sector rotation with earnings-driven volatility dominating headlines. Netflix (-11.82%) and Intuitive Surgical (-11.24%) are leading declines after disappointing guidance despite earnings beats, while The Travelers (+3.23%) stands out as the sole gainer among trending names. Banking sector shows mixed signals with TFC flat and FITB down -3.98%. SpaceX continues its steep decline (-40.03% monthly), reflecting broader tech weakness. The market appears to be in a "show me" earnings environment where guidance matters more than backward-looking results.
Market regime check (S&P 500 + sector/thematic ETFs)
Market futures are sliding with the Nasdaq 100 showing particular weakness (-1.62% in prior session), indicating continued pressure on growth and technology names. The S&P 500 closed down -0.51% while the Dow showed relative resilience at -0.20%, suggesting a rotation toward value and defensive sectors. Chip stocks are tumbling broadly, with geopolitical tensions (Iran) adding risk-off sentiment. The earnings season dynamic is creating high dispersion between winners and losers, with guidance quality becoming the primary driver of post-earnings moves.
Why these names are trending (search momentum + weekly/monthly price action)
Earnings-driven volatility leaders:
- NFLX (-11.82% today, -16.72% monthly): Massive volume spike (13.8M) on guidance disappointment
- ISRG (-11.24% today, -14.37% monthly): Medical device leader gapping down post-earnings despite beat
- SPCX (-40.03% monthly): Continued mega-cap tech weakness with sustained selling pressure
Defensive outperformers:
- TRV (+3.23% today, +13.44% monthly): Insurance sector strength amid market volatility
- TFC (+8.11% monthly): Banking sector beneficiary of rate environment expectations
The trending pattern reflects classic earnings season dynamics where execution matters less than forward guidance, creating sharp divergences in sector performance.
Key news drivers
- Netflix guidance miss: Q2 earnings beat of $0.80/share overshadowed by disappointing Q3 revenue projections, triggering 7.5% after-hours decline that extended in pre-market
- Intuitive Surgical earnings reaction: Despite Q2 revenue and earnings topping estimates, shares tumbled on likely guidance concerns or valuation reset after strong prior performance
- Broad tech sector weakness: Chip stocks tumbling with Nasdaq futures sliding, creating headwinds for growth names like SpaceX
- Geopolitical risk premium: Iran tensions adding risk-off sentiment, benefiting defensive sectors like insurance (TRV outperformance)
- Banking sector mixed signals: Earnings calendar activity suggesting upcoming quarterly results driving pre-positioning in financial names
Durable momentum ideas (mid/high-cap focus)
Bearish momentum (high conviction):
- NFLX: Guidance disappointment creates sustainable selling pressure; streaming competition intensifying
- SPCX: -40% monthly decline reflects fundamental re-rating of mega-cap tech valuations
- ISRG: Medical device sector facing margin pressure; earnings beat insufficient to offset guidance concerns
Bullish momentum (moderate conviction):
- TRV: Insurance sector benefiting from rate environment and defensive rotation; +13.44% monthly trend intact
- TFC: Banking sector positioning for potential rate cycle benefits; +8.11% monthly performance suggests institutional accumulation
Momentum sustainability factors: Earnings season creating lasting repricing based on guidance quality rather than historical performance, suggesting trends may persist through August reporting cycle.
Options / structure ideas
*This is educational analysis and not financial advice. Options involve substantial risk and may not be suitable for all investors.*
Primary bearish structures:
- NFLX PUT spreads: 66/62 put debit spread for 2026-07-24, capitalizing on guidance-driven weakness
- SPCX PUT spreads: 127/120 put debit spread targeting continued tech decline
- ISRG PUT spreads: 355/340 put debit spread on medical device sector pressure
Primary bullish structures:
- TRV CALL spreads: 350/360 call debit spread for 2026-08-21, riding insurance sector strength
- TFC CALL spreads: 52.5/55 call debit spread targeting banking momentum continuation
Critical liquidity warning: Multiple names showing $0.00 bid/ask spreads in ATM options despite volume, suggesting poor market making. Use limit orders and verify live quotes before execution.
Risks & watch-outs
Immediate risks:
- Options liquidity crisis: Multiple trending names showing poor bid/ask spreads despite volume
- Earnings volatility fade: Post-earnings moves may reverse quickly as attention shifts to next reporters
- Geopolitical escalation: Iran tensions could trigger broader risk-off moves affecting all sectors
Structural concerns:
- Guidance quality divergence: Market punishing even slight guidance misses, creating binary outcomes
- Sector rotation acceleration: Rapid shifts between growth/value creating whipsaw conditions
- Volume concentration: High volume in declining names suggests institutional distribution rather than retail panic
Key levels to monitor: S&P 500 support around recent lows, Nasdaq 100 technical breakdown levels, and VIX expansion above 20 signaling broader volatility regime shift.
Visual strategy maps
Payoff curves and entry/exit zones below are educational aids — not trade instructions. Confirm with your own chart, liquidity, and risk limits.
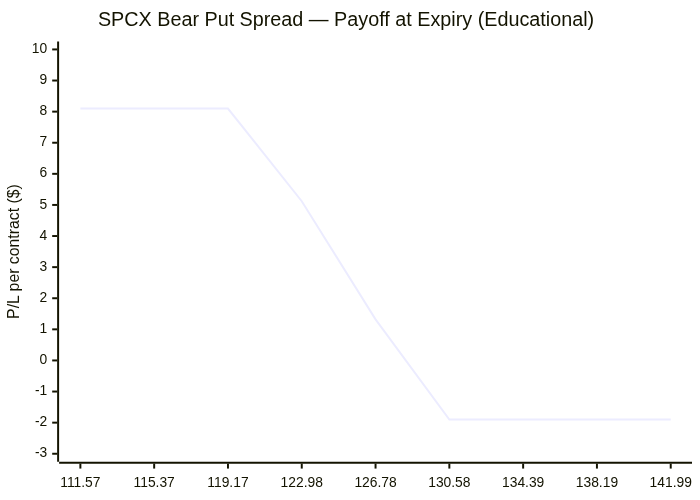
SPCX: Bear Put Spread
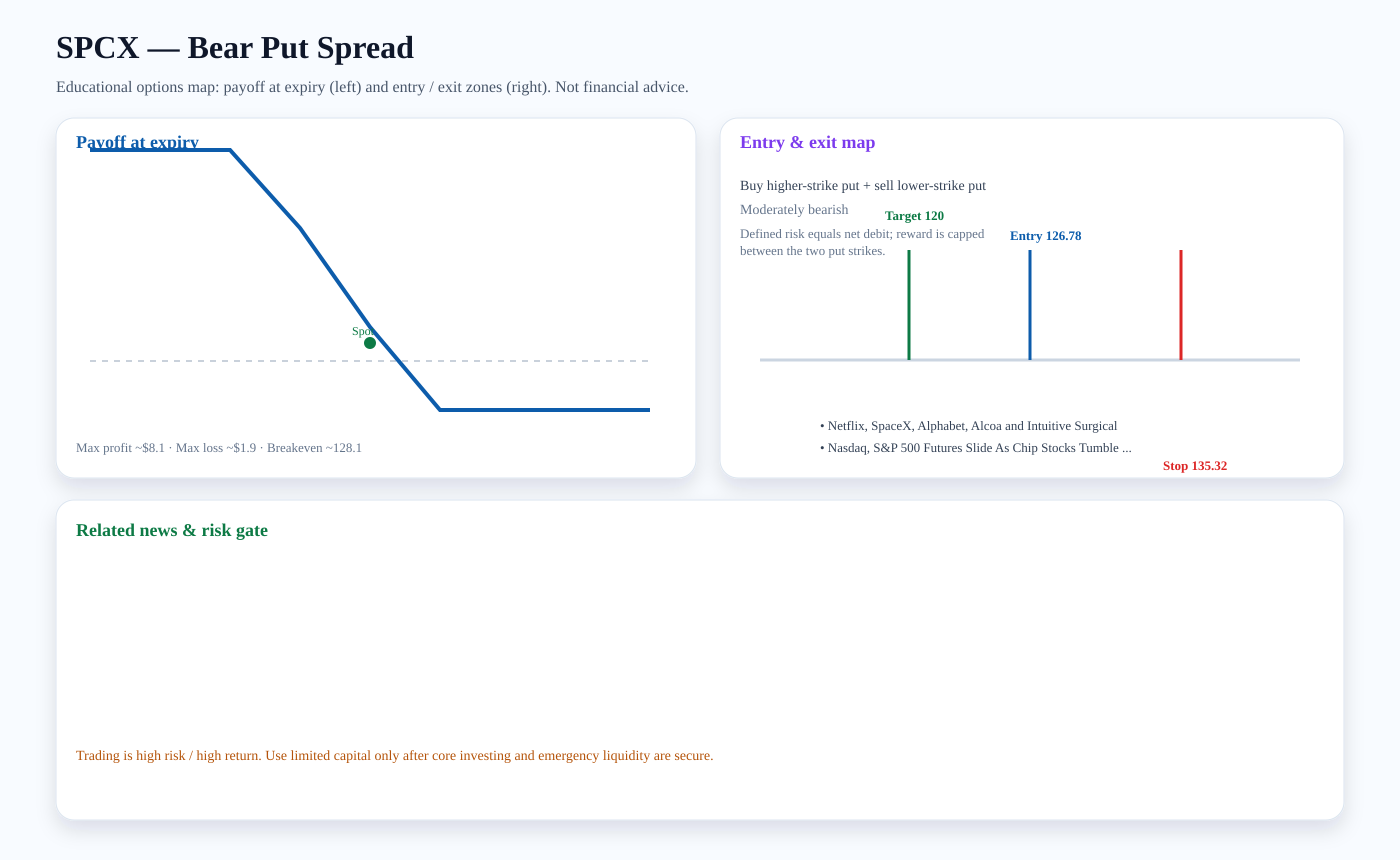
Structure: Buy higher-strike put + sell lower-strike put
Outlook: Moderately bearish
Entry zone: ~126.78 · Target: ~120 · Stop: ~135.32 · Breakeven: ~128.1
Risk note: Defined risk equals net debit; reward is capped between the two put strikes.
Related news links:
Payoff chart (Mermaid):
Entry / exit map (Mermaid):

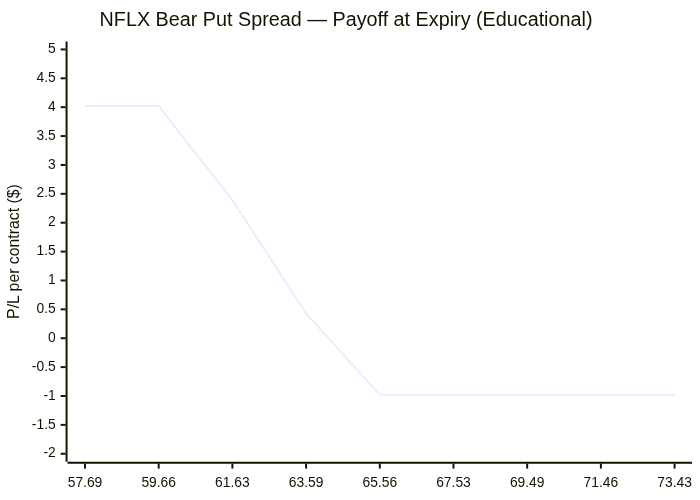
NFLX: Bear Put Spread
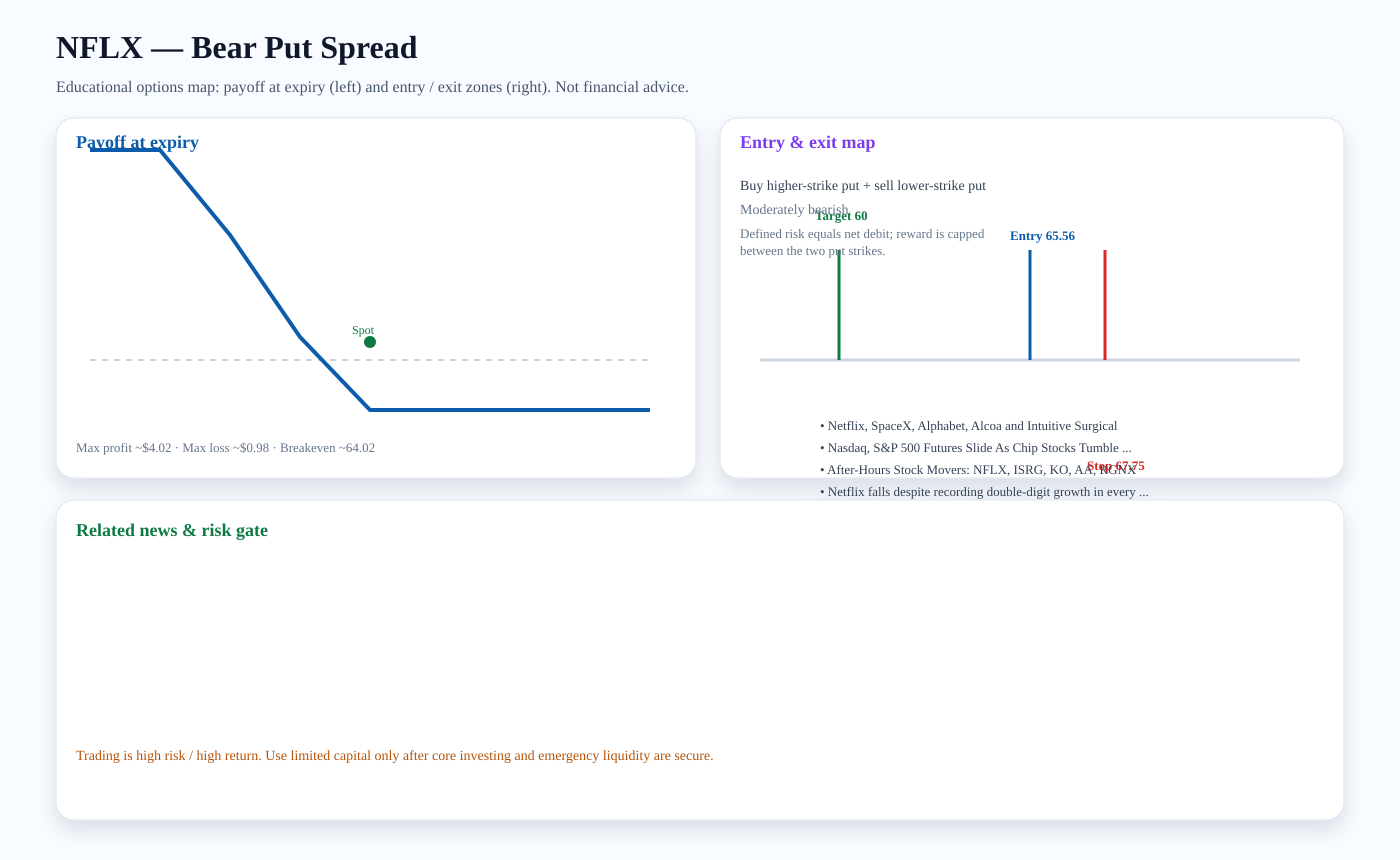
Structure: Buy higher-strike put + sell lower-strike put
Outlook: Moderately bearish
Entry zone: ~65.56 · Target: ~60 · Stop: ~67.75 · Breakeven: ~64.02
Risk note: Defined risk equals net debit; reward is capped between the two put strikes.
Related news links:
Payoff chart (Mermaid):
Entry / exit map (Mermaid):

ISRG: Bear Put Spread
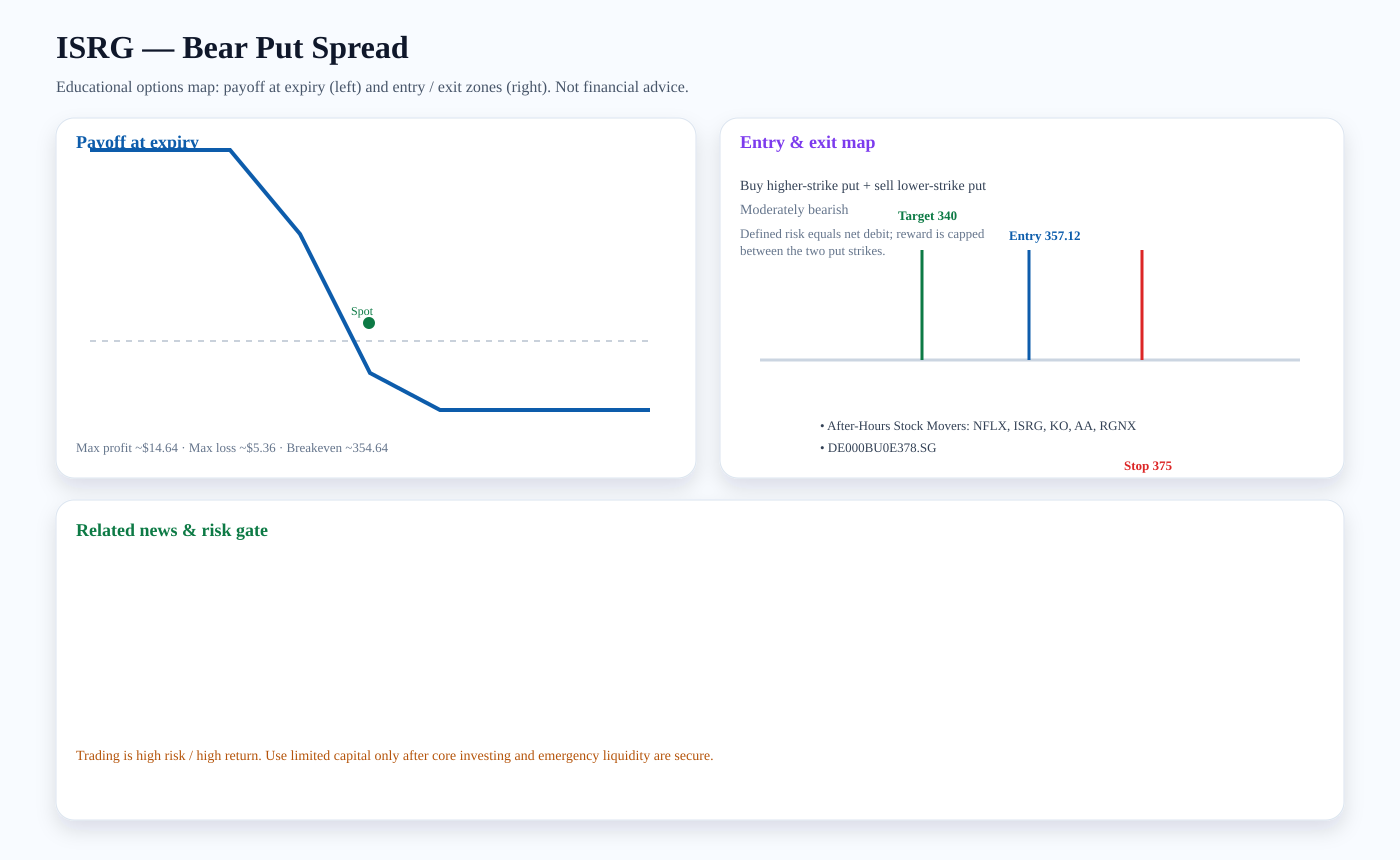
Structure: Buy higher-strike put + sell lower-strike put
Outlook: Moderately bearish
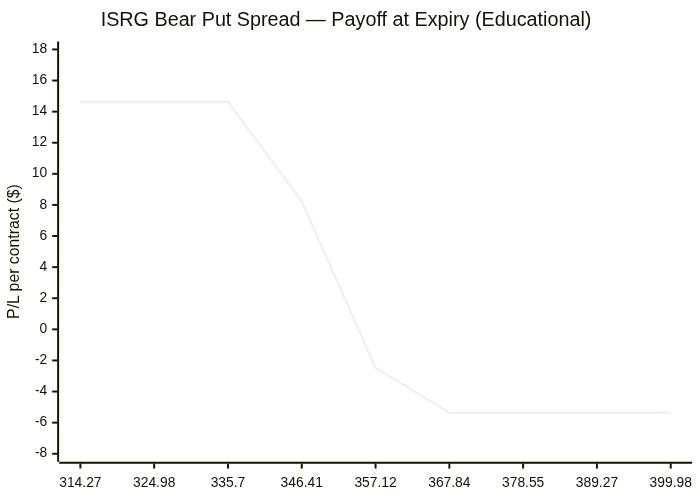
Entry zone: ~357.12 · Target: ~340 · Stop: ~375 · Breakeven: ~354.64
Risk note: Defined risk equals net debit; reward is capped between the two put strikes.
Related news links:
Payoff chart (Mermaid):
Entry / exit map (Mermaid):

TRV: Bull Call Spread
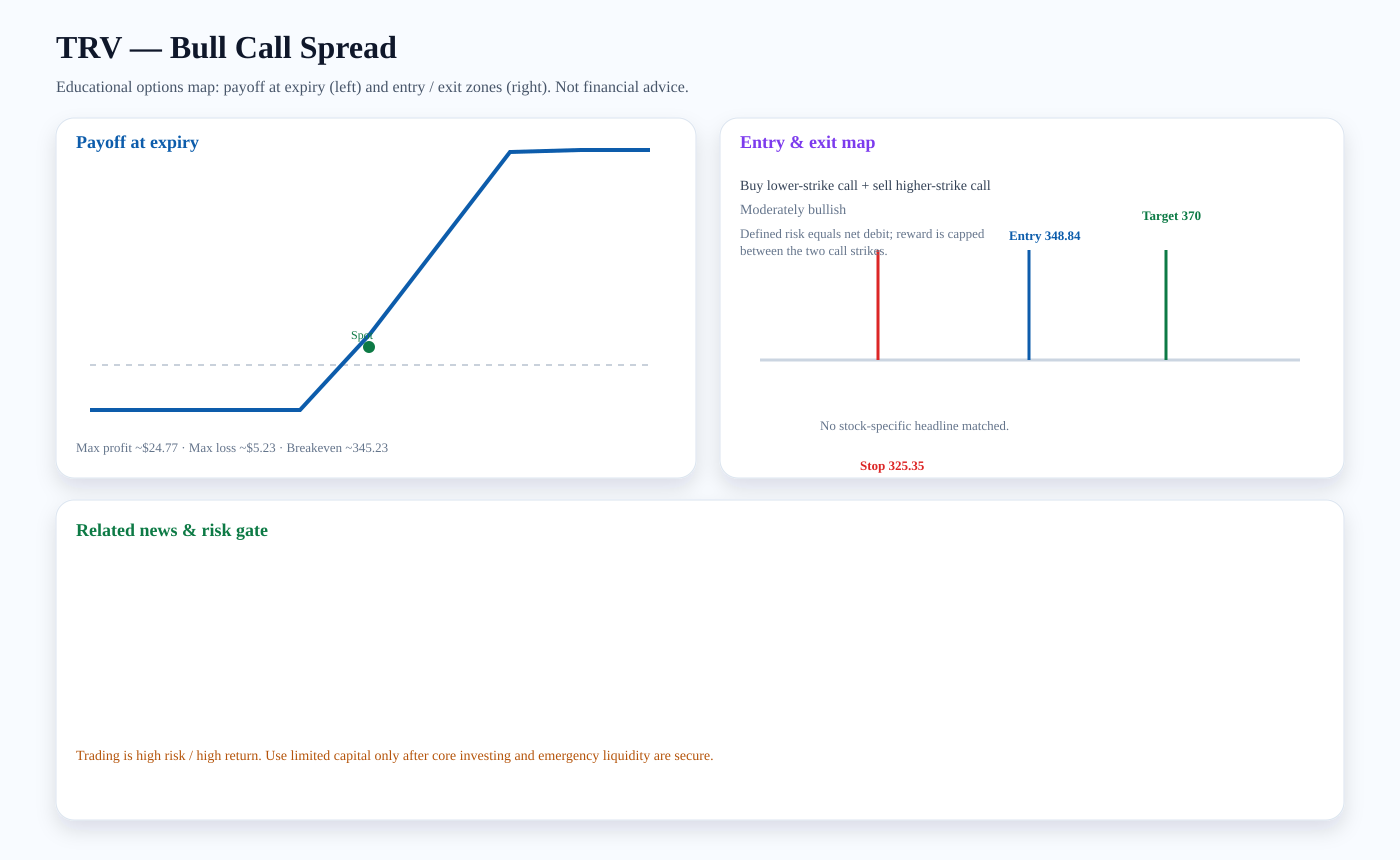
Structure: Buy lower-strike call + sell higher-strike call
Outlook: Moderately bullish
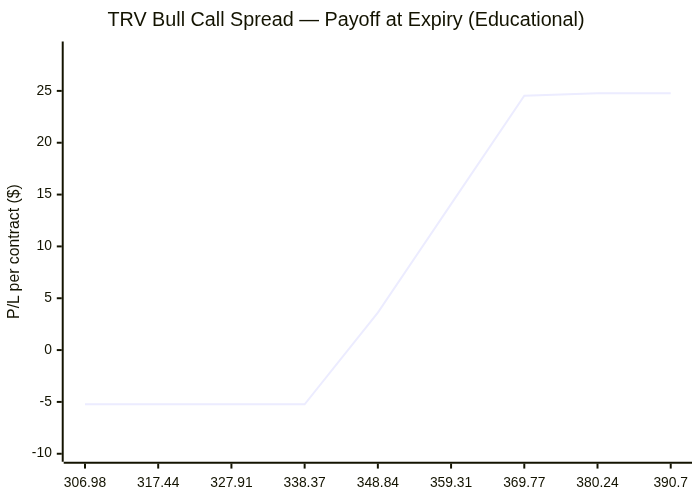
Entry zone: ~348.84 · Target: ~370 · Stop: ~325.35 · Breakeven: ~345.23
Risk note: Defined risk equals net debit; reward is capped between the two call strikes.
Payoff chart (Mermaid):
Entry / exit map (Mermaid):

Trading versus investing
Investing focuses on durable ownership, diversification, and compounding. Trading seeks faster tactical returns and carries higher risk. We treat options trading as limited-capital, educational analysis only after core investment capital and emergency liquidity are protected.
PDF report — Premium
Premium members get the full PDF attached to email briefs and can download it here. Upgrade for just $2 a month.
Subscribe for $2/month