
US Market Intelligence Brief
Report as-of (US/Eastern): 2026-07-20 09:05:07 EDT
Executive summary
Report as-of (US/Eastern): 2026-07-20 09:05:07 EDT
The US market is showing mixed signals with crypto-adjacent names leading momentum while traditional large-caps demonstrate steady gains. HUT (+13.05%) and IREN (+4.48%) are driving crypto mining interest, while BMY (+0.73%) continues its strong monthly trend (+9.85%) and BABA (+1.05%) extends recent gains. The trending names reflect a shift toward AI infrastructure plays, with IREN pivoting from pure Bitcoin mining to AI data centers via a reported $9.7B Microsoft partnership. However, concerning options liquidity across trending names suggests retail-driven momentum rather than institutional positioning.
Market regime check (S&P 500 + sector/thematic ETFs)
No major ETF data provided in current snapshot, limiting macro regime assessment. The trending names suggest:
- Crypto/Mining: Strong bounce attempt after significant monthly declines (HUT -24.72%, IREN -43.19%)
- Healthcare: Steady institutional accumulation (BMY +9.85% monthly)
- China Tech: Gradual recovery momentum (BABA +3.6% monthly)
- AI Infrastructure: Sector rotation from pure crypto plays to AI-enabled mining operations
Missing S&P 500, semiconductor, and volatility ETF data prevents comprehensive regime analysis.
Why these names are trending (search momentum + weekly/monthly price action)
IREN leads search volume despite -18.28% weekly decline, driven by AI infrastructure pivot story and Microsoft partnership headlines. The +4.48% premarket bounce suggests oversold relief after -43.19% monthly decline.
HUT shows strongest daily momentum (+13.05%) despite similar monthly weakness (-24.72%), indicating crypto mining sector rotation as investors reassess valuations after significant selloffs.
BMY trends on consistent performance – +5.49% weekly and +9.85% monthly gains reflect steady pharmaceutical sector strength and dividend appeal in uncertain markets.
BABA maintains search interest with modest but consistent gains (+2.35% weekly, +3.6% monthly), suggesting gradual confidence return in Chinese mega-cap tech names.
Key news drivers
IREN's AI Transformation: Headlines emphasize IREN's strategic shift from Bitcoin mining to AI cloud infrastructure, anchored by a reported $9.7B Microsoft supply agreement. This repositioning story drives search volume despite recent price weakness.
Crypto Mining Sector Analysis: Multiple articles compare IREN vs HUT positioning, with IREN "claiming the crown" in 2025 Bitcoin mining rankings, suggesting competitive dynamics driving investor interest.
Broader Tech Headlines: AWS billing glitches, Apple-OpenAI legal disputes, and AI regulation discussions create backdrop for infrastructure plays like IREN's Microsoft partnership.
Limited Fresh Catalysts: Most trending stock news consists of price quotes rather than fundamental developments, suggesting momentum driven by technical factors and sector rotation.
Durable momentum ideas (mid/high-cap focus)
BMY (Large-Mid Cap): Most sustainable momentum candidate with +9.85% monthly trend supported by healthcare sector stability and dividend yield appeal. Pharmaceutical names often maintain momentum through earnings seasons.
BABA (Mega Cap): Gradual recovery trajectory (+3.6% monthly) suggests institutional re-accumulation after regulatory overhang clearing. Chinese tech rebound could sustain through policy support.
HUT (Large-Mid Cap): Despite monthly weakness, crypto mining names historically show high beta to Bitcoin recovery cycles. Current oversold levels may support continued bounces if crypto sentiment improves.
IREN (Large-Mid Cap): AI infrastructure pivot provides fundamental re-rating catalyst beyond crypto cycles. Microsoft partnership, if confirmed, offers revenue diversification supporting higher valuations.
Options / structure ideas
*This is educational analysis, not financial advice.*
Primary Focus: BMY (Highest conviction)
- Call-side: 61C/62C debit spread (2026-07-24) targeting momentum continuation
- Put-side: Cash-secured 60P for income on pullbacks
- Rationale: Best liquidity, established uptrend, lower volatility than crypto names
Secondary: BABA
- Call-side: 119C/122C debit spread capturing gradual recovery
- Put-side: 115P cash-secured puts for long-term accumulation
- Rationale: Mega-cap liquidity, steady momentum, geopolitical risk manageable
Speculative: HUT
- Call-side: 104C/108C debit spread on gap-up momentum
- Put-side: 95P cash-secured for gap-fill entries
- Rationale: Strongest daily move but highest risk
Critical Liquidity Warning: All trending names show $0.00 bid/ask spreads in options data, indicating stale quotes or poor liquidity. Verify live markets before execution.
Risks & watch-outs
Liquidity Concerns: Poor options liquidity across all trending names suggests retail-driven momentum vulnerable to rapid reversals without institutional support.
Crypto Volatility: HUT and IREN remain highly correlated to Bitcoin price action despite AI pivots. Crypto selloffs could overwhelm fundamental improvements.
Geopolitical Sensitivity: BABA remains exposed to US-China tensions and regulatory changes that could quickly reverse momentum.
Short Expiry Risk: 4-day options expiries (2026-07-24) provide limited time for thesis development, creating high theta decay risk.
Momentum Exhaustion: Strong recent moves in BMY (+9.85% monthly) and crypto bounces may face profit-taking pressure at resistance levels.
Missing Macro Context: Lack of major ETF data limits ability to assess broader market regime supporting individual name momentum.
Visual strategy maps
Payoff curves and entry/exit zones below are educational aids — not trade instructions. Confirm with your own chart, liquidity, and risk limits.
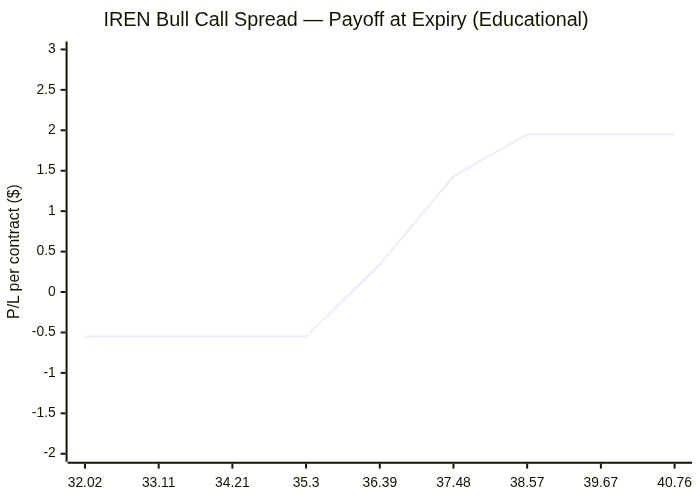
IREN: Bull Call Spread
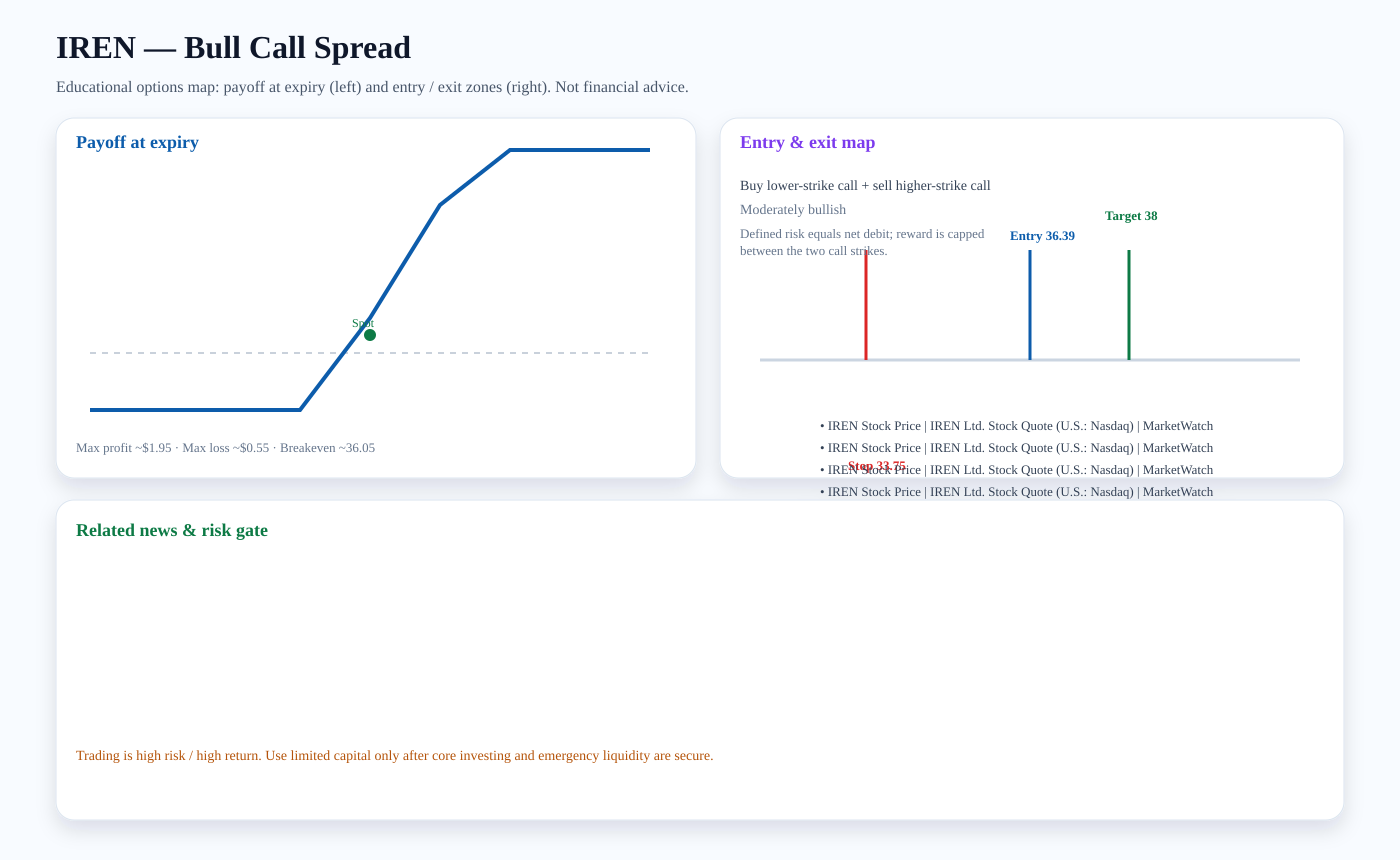
Structure: Buy lower-strike call + sell higher-strike call
Outlook: Moderately bullish
Entry zone: ~36.39 · Target: ~38 · Stop: ~33.75 · Breakeven: ~36.05
Risk note: Defined risk equals net debit; reward is capped between the two call strikes.
Related news links:
Payoff chart (Mermaid):
Entry / exit map (Mermaid):

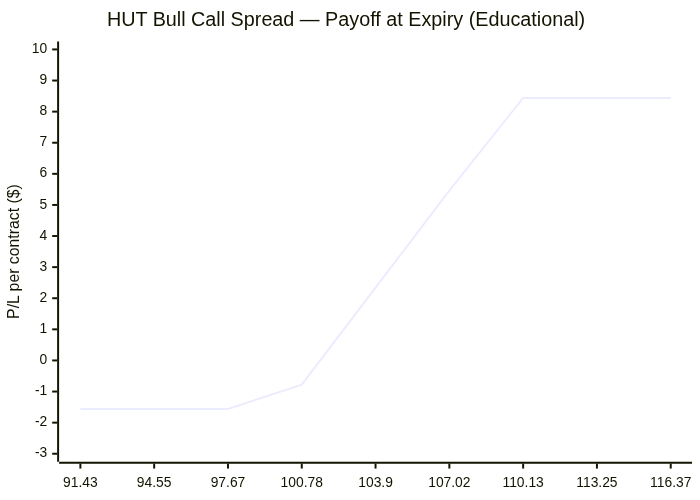
HUT: Bull Call Spread
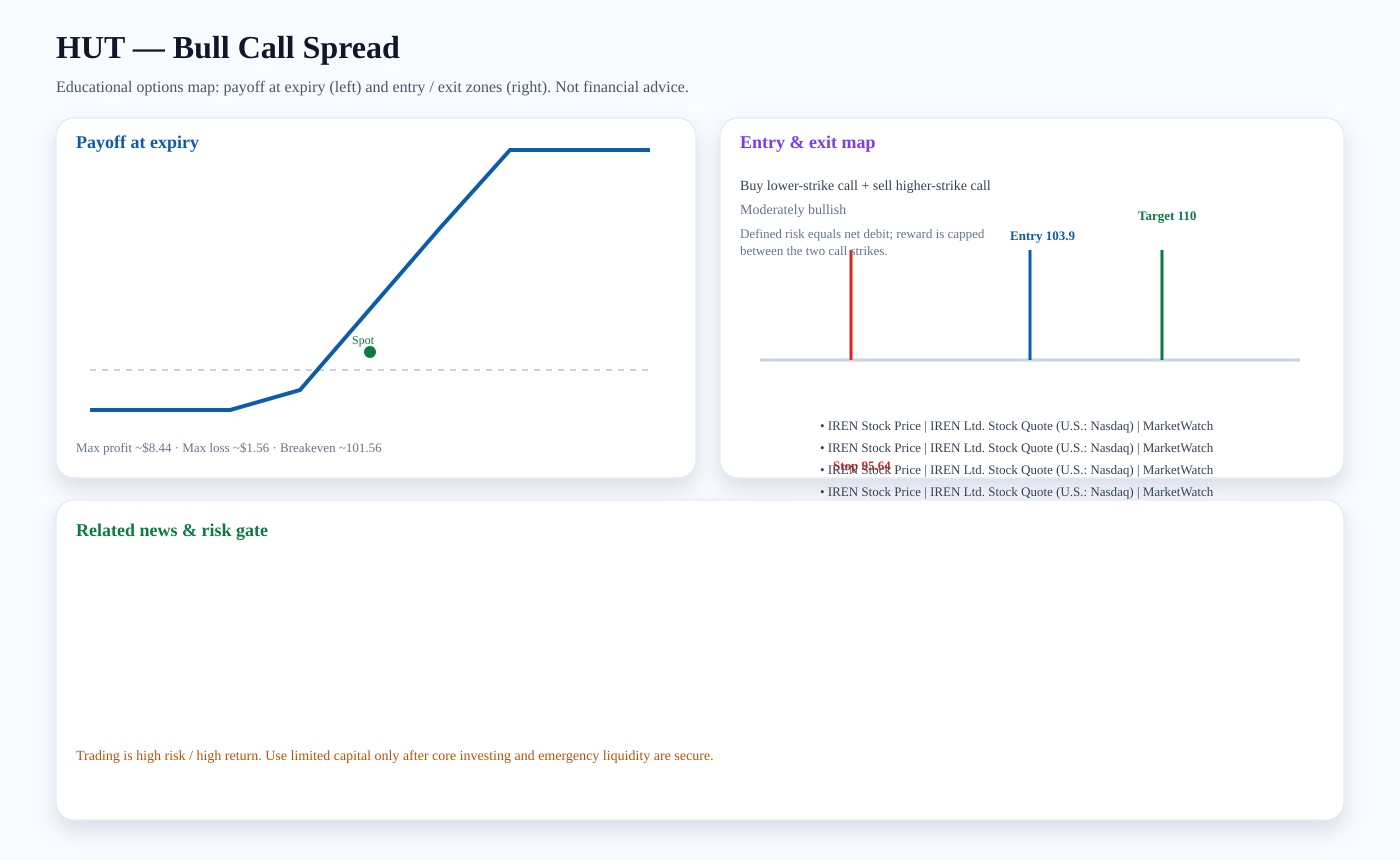
Structure: Buy lower-strike call + sell higher-strike call
Outlook: Moderately bullish
Entry zone: ~103.9 · Target: ~110 · Stop: ~95.64 · Breakeven: ~101.56
Risk note: Defined risk equals net debit; reward is capped between the two call strikes.
Related news links:
Payoff chart (Mermaid):
Entry / exit map (Mermaid):

BMY: Bull Call Spread
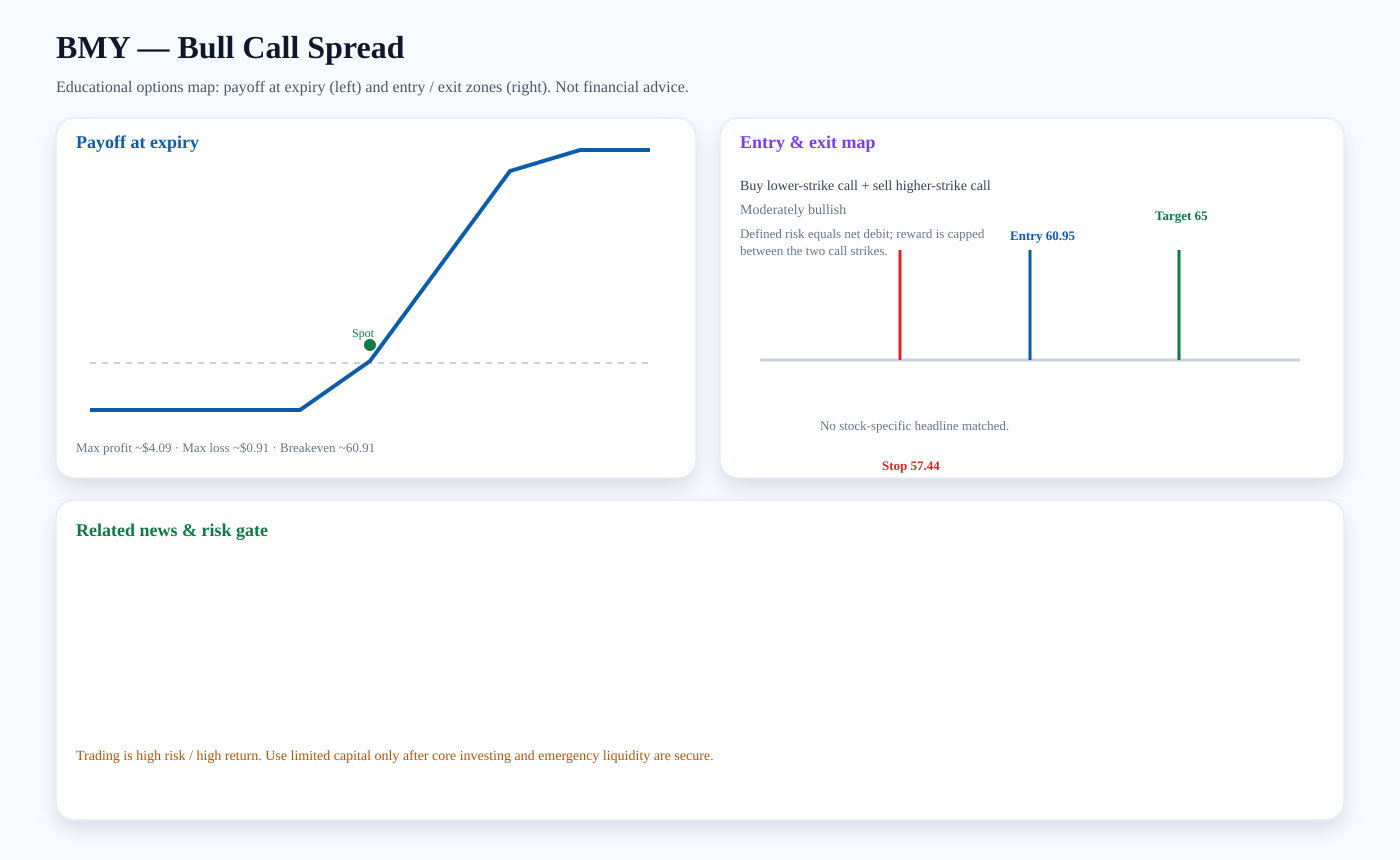
Structure: Buy lower-strike call + sell higher-strike call
Outlook: Moderately bullish
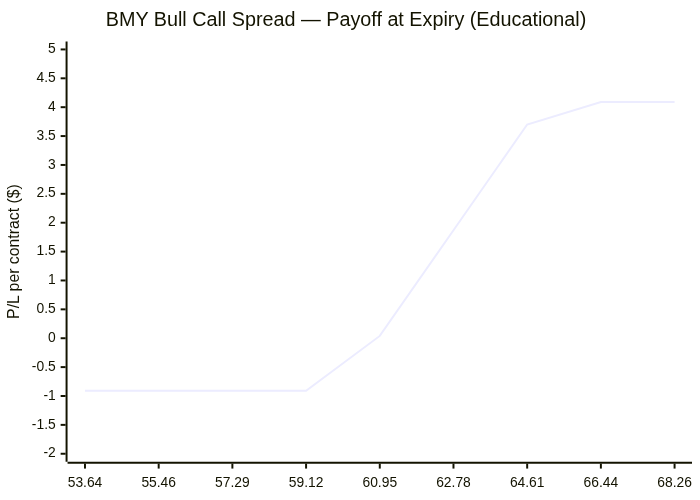
Entry zone: ~60.95 · Target: ~65 · Stop: ~57.44 · Breakeven: ~60.91
Risk note: Defined risk equals net debit; reward is capped between the two call strikes.
Payoff chart (Mermaid):
Entry / exit map (Mermaid):

BABA: Bull Call Spread
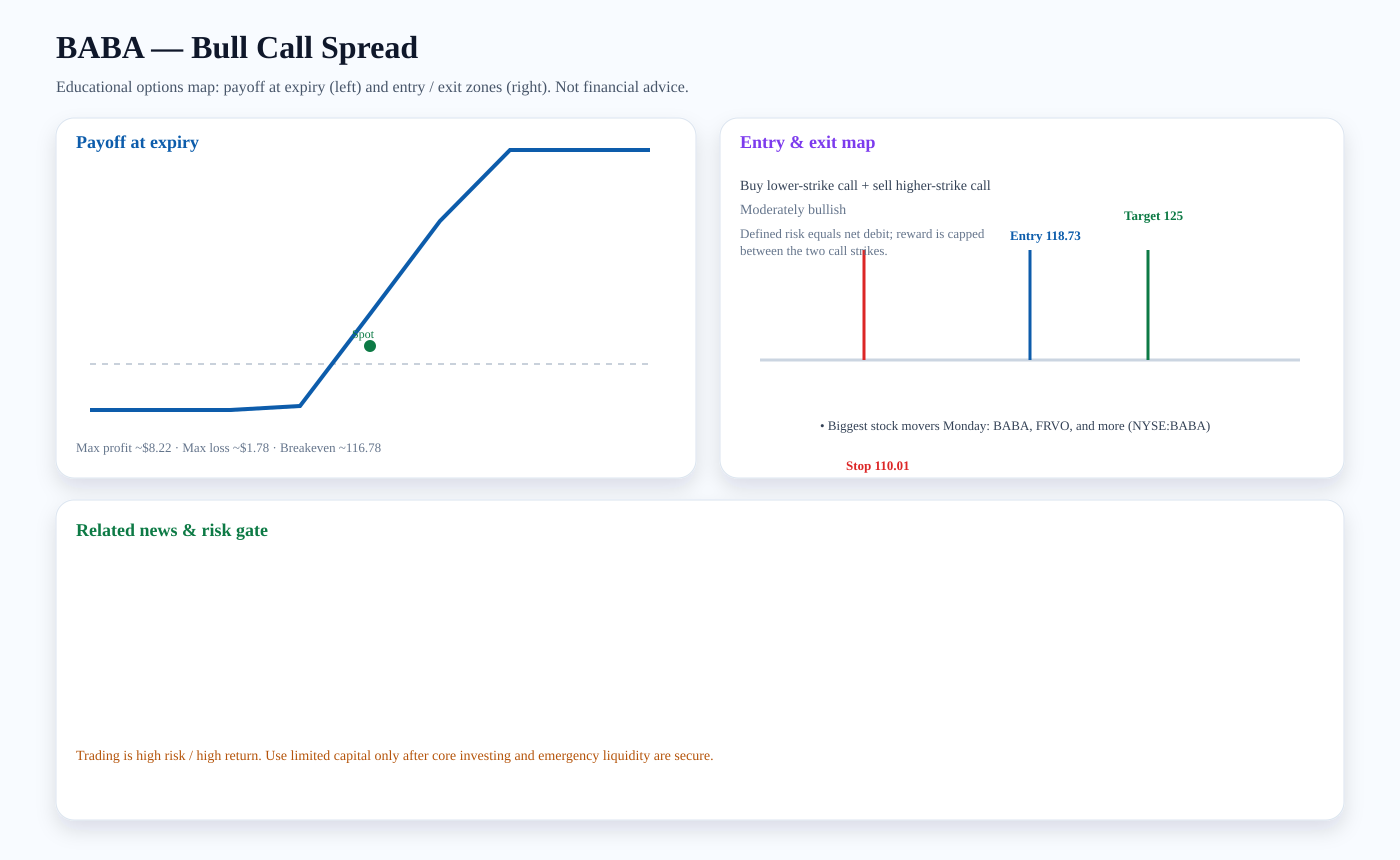
Structure: Buy lower-strike call + sell higher-strike call
Outlook: Moderately bullish
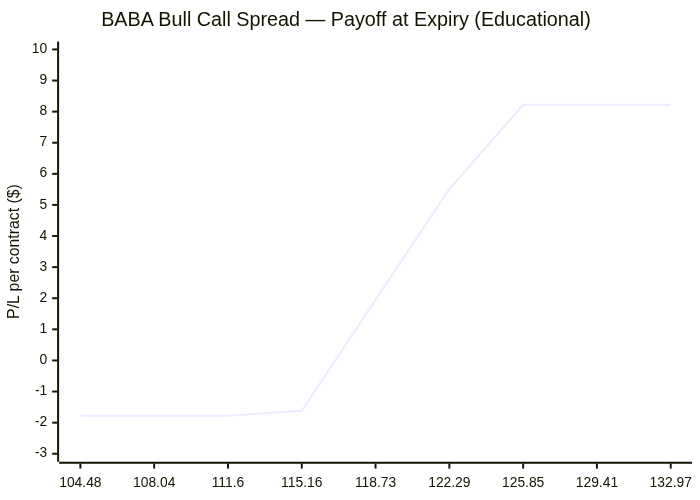
Entry zone: ~118.73 · Target: ~125 · Stop: ~110.01 · Breakeven: ~116.78
Risk note: Defined risk equals net debit; reward is capped between the two call strikes.
Related news links:
Payoff chart (Mermaid):
Entry / exit map (Mermaid):

Trading versus investing
Investing focuses on durable ownership, diversification, and compounding. Trading seeks faster tactical returns and carries higher risk. We treat options trading as limited-capital, educational analysis only after core investment capital and emergency liquidity are protected.
PDF report — Premium
Premium members get the full PDF attached to email briefs and can download it here. Upgrade for just $2 a month.
Subscribe for $2/month