
US Market Intelligence Brief
Report as-of (US/Eastern): 2026-06-26 09:05:01 EDT
Executive summary
Report as-of (US/Eastern): 2026-06-26 09:05:01 EDT
US equity markets are experiencing significant semiconductor sector volatility, with AI infrastructure costs creating a complex dynamic of surging demand alongside supply chain pressures. Apple (-5.77%) and ON Semiconductor (-11.95%) lead today's trending names, both pressured by memory/storage cost inflation that Apple can no longer absorb. The "chipflation" theme is reshaping consumer electronics pricing while highlighting AI infrastructure bottlenecks. Despite sector-wide revenue growth (+345% reported for some chip names), cost pressures and supply constraints are creating near-term headwinds for previously strong performers.
Market regime check (S&P 500 + sector/thematic ETFs)
While specific ETF data isn't provided, the semiconductor sector is clearly under pressure despite strong AI-driven fundamentals. The divergence between revenue growth (+345% for select chip companies) and stock performance (ON -11.95%, AAPL -5.77%) suggests a regime shift from pure AI euphoria to margin/cost reality. Apple's acknowledgment that it can no longer absorb memory costs represents a potential inflection point for the broader tech ecosystem. The "100-year flood" characterization of memory costs by Apple management indicates this isn't a temporary blip but a structural shift requiring pricing adjustments across the industry.
Why these names are trending (search momentum + weekly/monthly price action)
AAPL trends on price action (weekly -7.03%, monthly -10.76%) and the significant news of raising iPad/MacBook prices 20% due to AI-driven memory shortages. The company's inability to absorb component costs marks a strategic shift.
ON Semiconductor trends due to the dramatic -11.95% gap down despite positive weekly momentum (+5.15%), creating a technical inflection point. The semiconductor sector's mixed signals – strong AI demand versus supply chain costs – make ON a bellwether for the industry.
Both names represent the core tension in today's AI infrastructure build-out: explosive demand meeting supply constraints and cost inflation.
Key news drivers
- Apple's pricing power test: 20% price hikes on select Mac/iPad models signal memory cost crisis, with iPhones potentially next
- Memory supply crunch: Micron's HBM supply entirely sold out, validating AI infrastructure demand but creating bottlenecks
- Semiconductor sector divergence: Revenue growth of 345%+ for some chip companies contrasts with stock performance, suggesting valuation/margin concerns
- Chinese AI/chip IPO rebound: Beijing pushing domestic listings, potentially affecting global supply chain dynamics
- Qualcomm's $4B Modular acquisition: Major consolidation move in AI chip space, indicating strategic positioning for next phase
Durable momentum ideas (mid/high-cap focus)
Memory/storage suppliers likely maintain momentum as Apple's pricing actions validate supply tightness. Companies like Micron benefit from sold-out HBM capacity and Apple's acknowledgment of structural cost increases.
AI infrastructure plays beyond consumer devices should sustain momentum as enterprise/data center spending continues regardless of consumer price sensitivity.
Apple's ecosystem resilience may prove durable if consumers accept higher prices for AI-enhanced devices, though this represents a key test of pricing power.
The momentum sustainability depends on whether AI demand growth outpaces supply chain normalization – current evidence suggests supply constraints persist through 2026.
Options / structure ideas
AAPL
Primary idea: PUT
• Bias: Bearish – AAPL down -5.77% with weak weekly (-7.03%) and monthly (-10.76%) trends
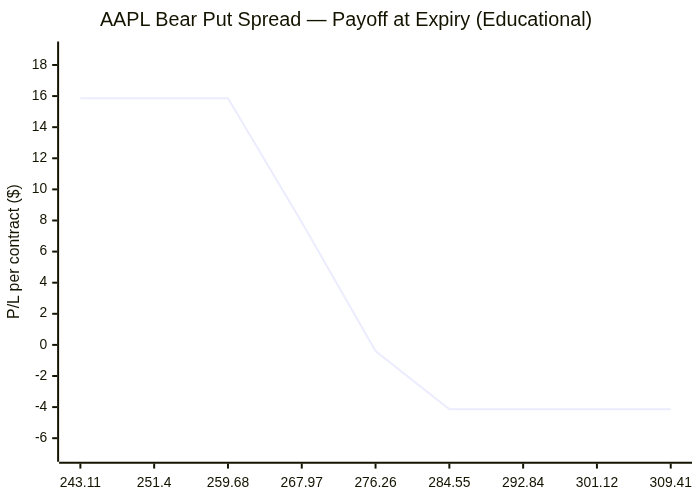
• Primary structure: Put debit spread targeting 2026-07-10 expiry, 275P/265P spread
• Call-side structure: Covered calls at 285-290 strikes for income generation
• Key risk: Liquidity concerns with 0.0 bid/ask spreads on ATM options
ON
Primary idea: PUT
• Bias: Bearish – Significant -11.95% gap down breaks recent weekly strength
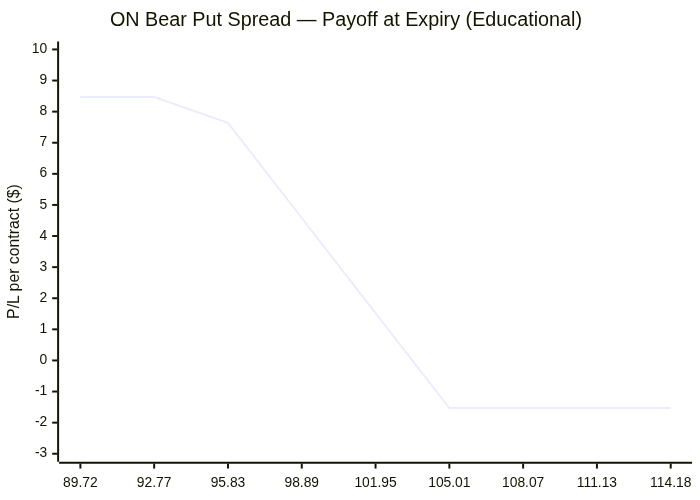
• Primary structure: Put debit spread 102P/95P for 2026-07-10 expiry
• Call-side structure: Wait for stabilization before considering calls
• Key risk: Poor options liquidity, potential oversold bounce
*This is educational content and not financial advice.*
Risks & watch-outs
Liquidity deterioration: Both AAPL and ON showing concerning 0.0 bid/ask spreads in options, suggesting market maker withdrawal during volatility.
Oversold bounce potential: Sharp declines may trigger technical rebounds, especially in ON after -11.95% gap.
AI demand sustainability: If AI infrastructure spending slows, the entire semiconductor thesis faces pressure.
Consumer price elasticity: Apple's pricing test could reveal demand destruction if consumers reject higher prices.
Geopolitical semiconductor risks: China's domestic chip push and ongoing trade tensions could disrupt supply chains further.
Memory cycle timing: Historical semiconductor cycles suggest current tightness could reverse quickly if demand moderates.
Visual strategy maps
Payoff curves and entry/exit zones below are educational aids — not trade instructions. Confirm with your own chart, liquidity, and risk limits.
AAPL: Bear Put Spread
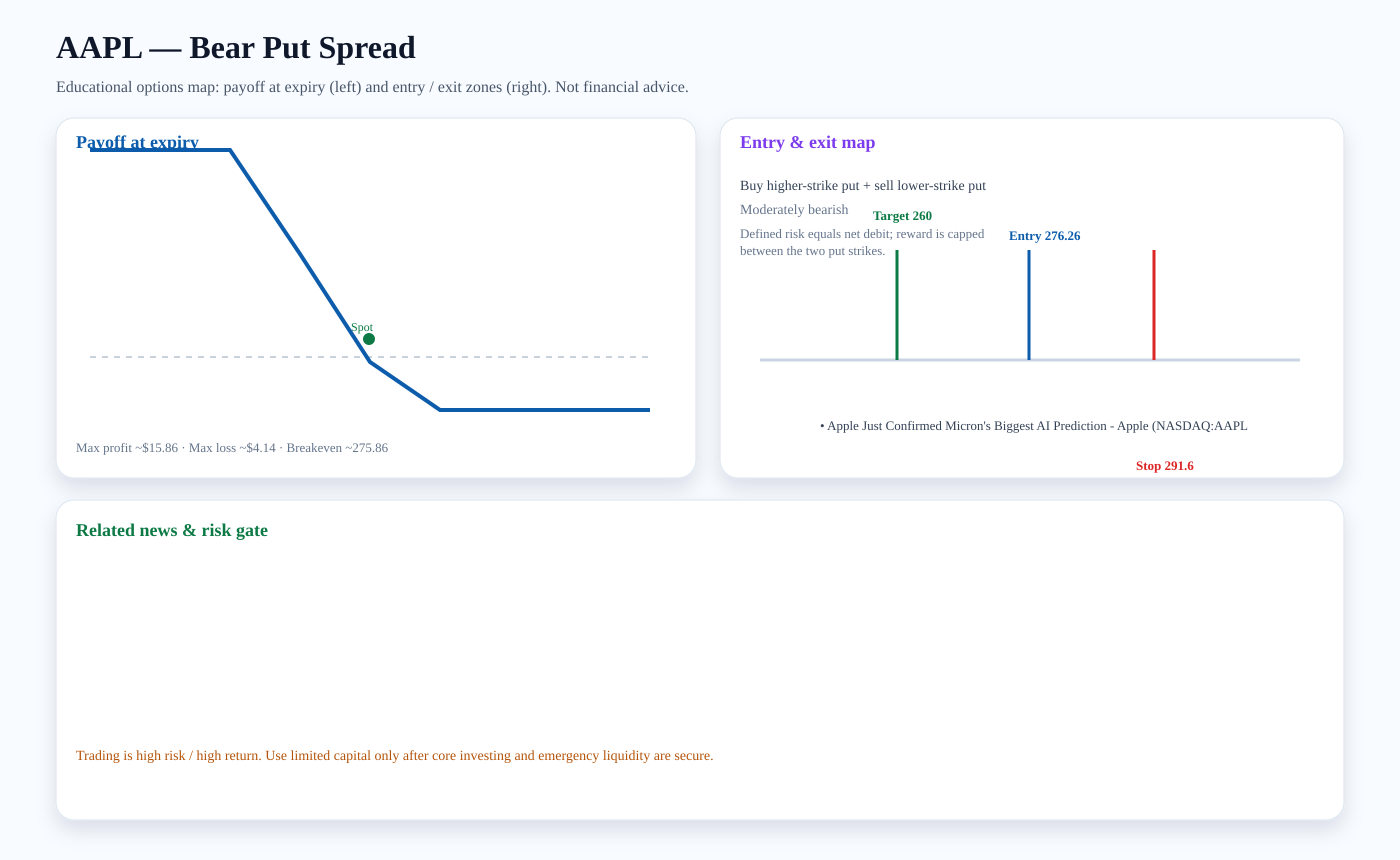
Structure: Buy higher-strike put + sell lower-strike put
Outlook: Moderately bearish
Entry zone: ~276.26 · Target: ~260 · Stop: ~291.6 · Breakeven: ~275.86
Risk note: Defined risk equals net debit; reward is capped between the two put strikes.
Related news links:
Payoff chart (Mermaid):
Entry / exit map (Mermaid):

ON: Bear Put Spread
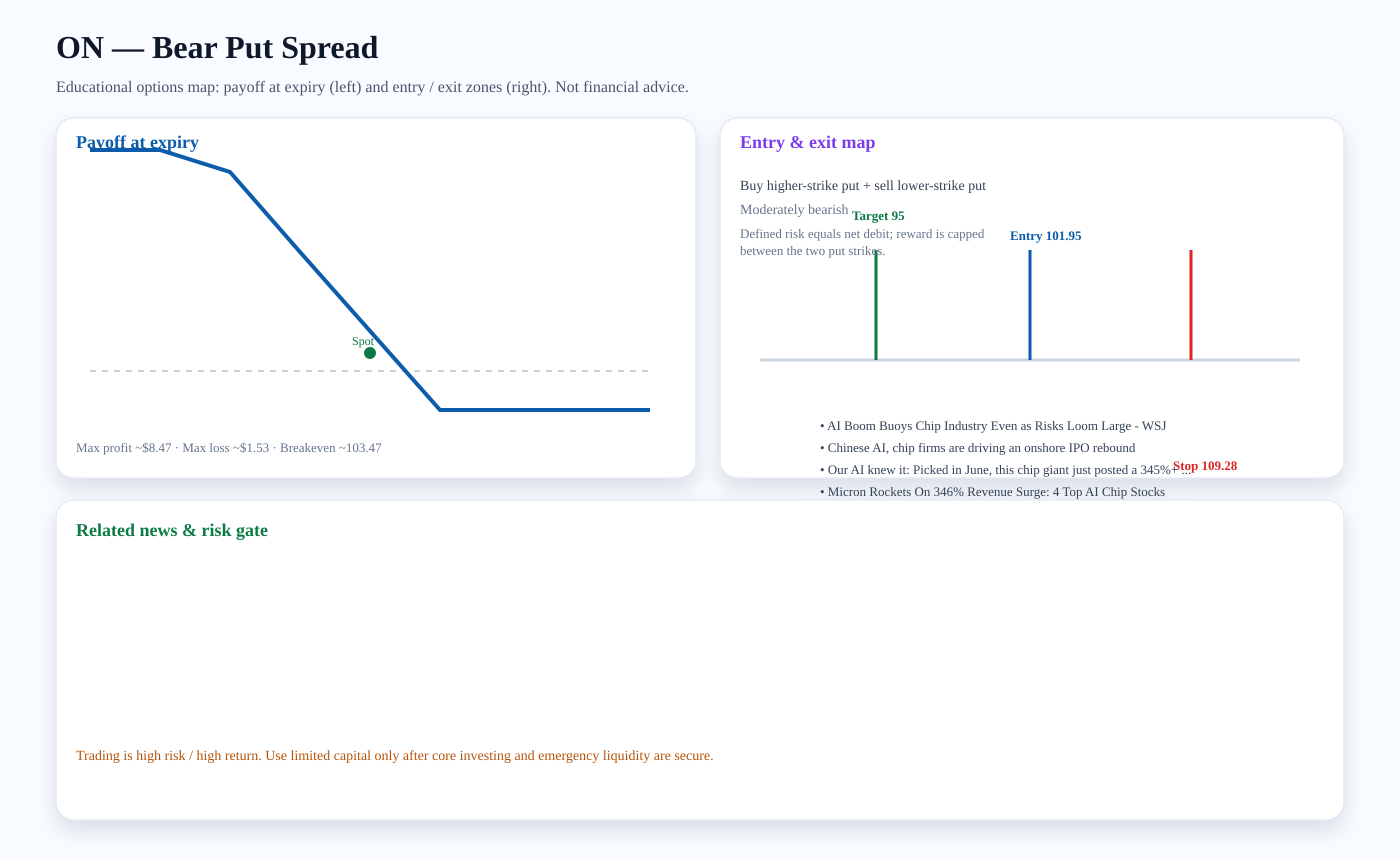
Structure: Buy higher-strike put + sell lower-strike put
Outlook: Moderately bearish
Entry zone: ~101.95 · Target: ~95 · Stop: ~109.28 · Breakeven: ~103.47
Risk note: Defined risk equals net debit; reward is capped between the two put strikes.
Related news links:
Payoff chart (Mermaid):
Entry / exit map (Mermaid):

Trading versus investing
Investing focuses on durable ownership, diversification, and compounding. Trading seeks faster tactical returns and carries higher risk. We treat options trading as limited-capital, educational analysis only after core investment capital and emergency liquidity are protected.
PDF report — Premium
Premium members get the full PDF attached to email briefs and can download it here. Upgrade for just $2 a month.
Subscribe for $2/month