
US Market Intelligence Brief
Report as-of (US/Eastern): 2026-06-26 09:31:28 EDT
Executive summary
Report as-of (US/Eastern): 2026-06-26 09:31:28 EDT
The US market shows mixed signals with Apple (AAPL) demonstrating resilience at +0.50% while ON Semiconductor faces severe pressure at -19.11%. The trending names reflect a tech-heavy focus amid ongoing AI sector developments. Semiconductor stocks are experiencing significant volatility, with Qualcomm's $4B acquisition of Modular highlighting continued consolidation in the chip sector. Apple's modest gains against a backdrop of monthly weakness (-11.03%) suggest potential oversold bounce opportunities, while ON's massive selloff indicates sector-specific headwinds.
Market regime check (S&P 500 + sector/thematic ETFs)
No major ETF data captured in current snapshot, limiting broader market context assessment. However, the semiconductor sector appears under pressure based on ON's -19% decline and broader chip sector consolidation activity. The AI theme remains prominent in headlines with multiple stories covering Anthropic, Meta, and Qualcomm's strategic moves, suggesting continued investor focus on artificial intelligence infrastructure and development.
Why these names are trending (search momentum + weekly/monthly price action)
AAPL leads trending searches despite modest daily gains (+0.50%), likely driven by its oversold condition after declining -7.19% weekly and -11.03% monthly. The mega-cap name's relative stability amid tech sector turbulence makes it a focal point for potential bounce plays.
ON Semiconductor trends due to dramatic -19.11% selloff, representing a significant breakdown from already weak technicals (-21.03% weekly, -23.10% monthly). The large-mid cap semiconductor name's collapse likely reflects broader sector concerns and potential company-specific issues.
Other trending names (ILLR, TII, IVF, INLF, CANF, SLS, SDOT, SHPH) lack sufficient data for analysis but suggest diverse sector interest beyond mega-cap tech.
Key news drivers
- Qualcomm's $4B Modular acquisition signals aggressive AI chip consolidation, potentially pressuring smaller semiconductor players like ON
- Meta's employee data leak regarding tracking programs adds regulatory overhang to tech sector
- Anthropic's AI safety positioning and broader AI development concerns suggest continued sector volatility
- Amazon-OpenAI project cancellation indicates potential cooling in some AI partnerships
- Data center infrastructure tensions with worker pushback may impact cloud/AI infrastructure buildout
Durable momentum ideas (mid/high-cap focus)
AAPL oversold bounce potential: Monthly decline of -11.03% in a quality mega-cap creates technical setup for relief rally. Apple's fundamental strength and cash position support bounce thesis from current $276 levels.
Semiconductor sector consolidation play: Qualcomm's aggressive M&A activity suggests stronger players will acquire distressed assets. Focus on large-cap semiconductor names with strong balance sheets rather than struggling mid-caps like ON.
AI infrastructure theme: Despite volatility, continued AI development and data center expansion provide long-term tailwinds for established tech infrastructure players.
Options / structure ideas
AAPL
Primary idea: CALL
• Primary structure: Call debit spread (Buy 275C/Sell 280C) targeting oversold bounce from monthly lows
• Call-side rationale: Quality name oversold after -11% monthly decline, showing relative strength today
• Put-side alternative: Cash-secured puts at 270 strike for income generation during consolidation
• Tenor: 2-3 weeks (July 10th expiry) to capture potential relief rally
• Risk: Poor liquidity evident in options chain, verify spreads before execution
ON
Primary idea: PUT
• Primary structure: Put debit spread (Buy 95P/Sell 90P) capitalizing on breakdown momentum
• Put-side rationale: -19% gap down with weak technicals (-21% weekly) suggests further decline
• Call-side alternative: Wait for oversold bounce setup before considering covered calls
• Tenor: Near-term (July 10th) to capture continued weakness
• Risk: Severe liquidity concerns in options chain, potential for sharp reversal after major selloff
*This is educational analysis and not financial advice. Verify current bid/ask spreads and liquidity before trading.*
Risks & watch-outs
- Options liquidity crisis: Both AAPL and ON showing concerning $0.00 bid/ask spreads despite volume, suggesting market maker issues or stale data
- Semiconductor sector volatility: ON's -19% decline may signal broader chip sector stress beyond company-specific issues
- AI sector rotation risk: Despite headlines, AI stocks showing mixed performance with potential for sentiment shift
- Macro uncertainty: Limited ETF data prevents assessment of broader market regime and sector rotation patterns
- Execution risk: Poor options liquidity across trending names may create significant slippage and execution challenges
Key monitoring levels: AAPL support at $270, ON breakdown continuation below $95, and broader semiconductor sector performance for contagion risk assessment.
Visual strategy maps
Payoff curves and entry/exit zones below are educational aids — not trade instructions. Confirm with your own chart, liquidity, and risk limits.
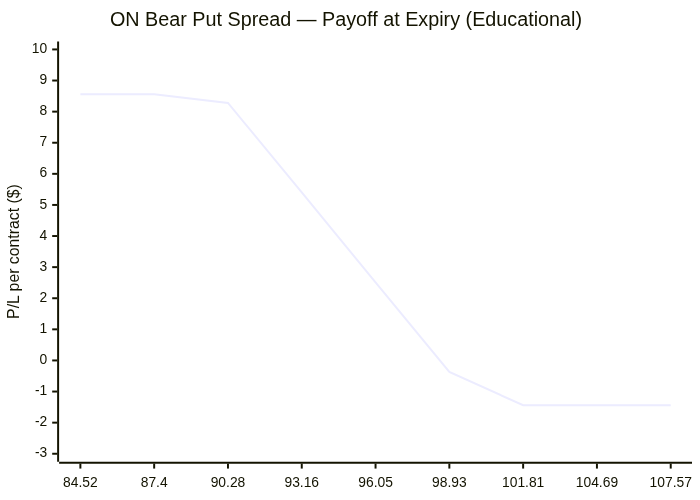
ON: Bear Put Spread
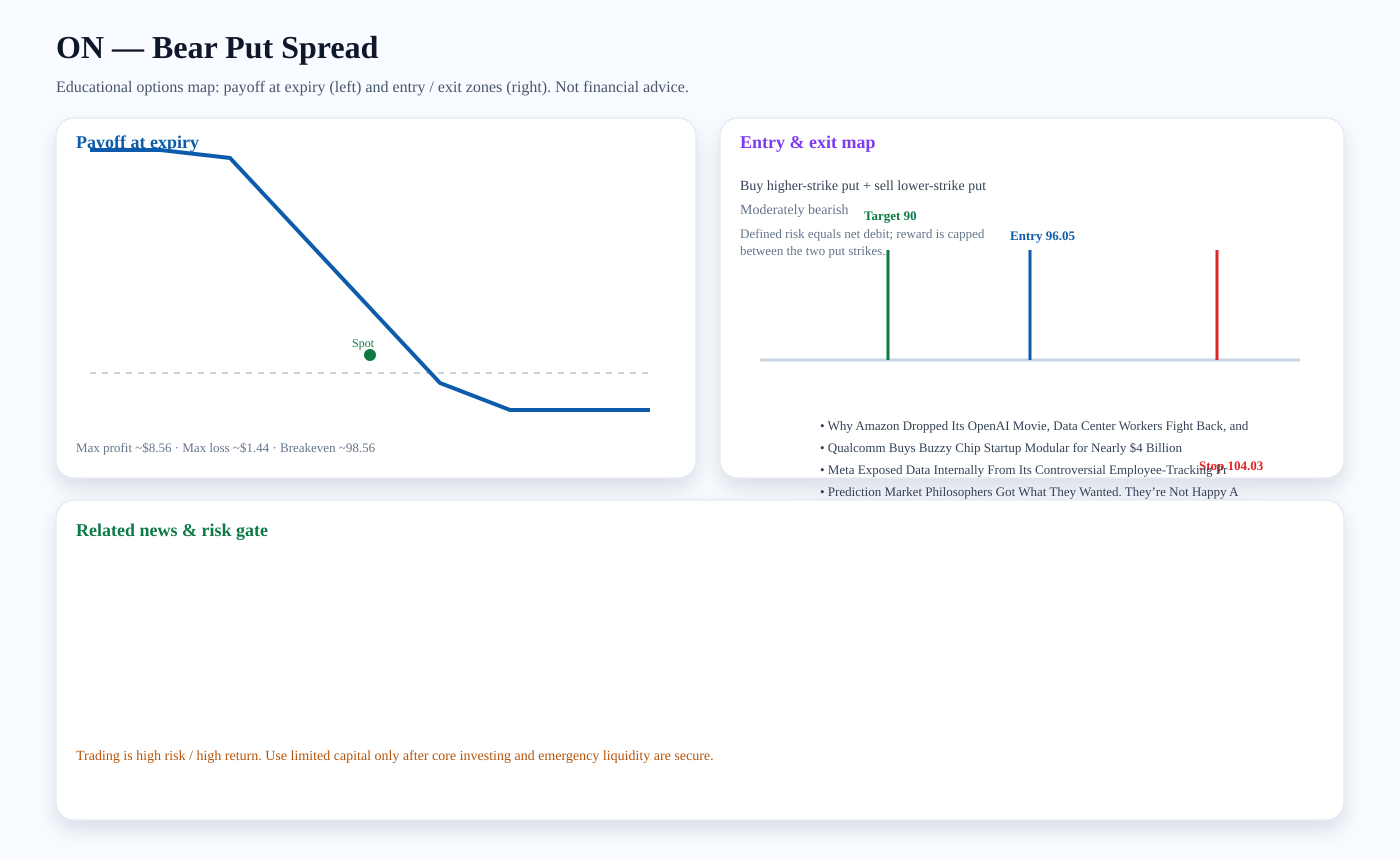
Structure: Buy higher-strike put + sell lower-strike put
Outlook: Moderately bearish
Entry zone: ~96.05 · Target: ~90 · Stop: ~104.03 · Breakeven: ~98.56
Risk note: Defined risk equals net debit; reward is capped between the two put strikes.
Related news links:
Payoff chart (Mermaid):
Entry / exit map (Mermaid):

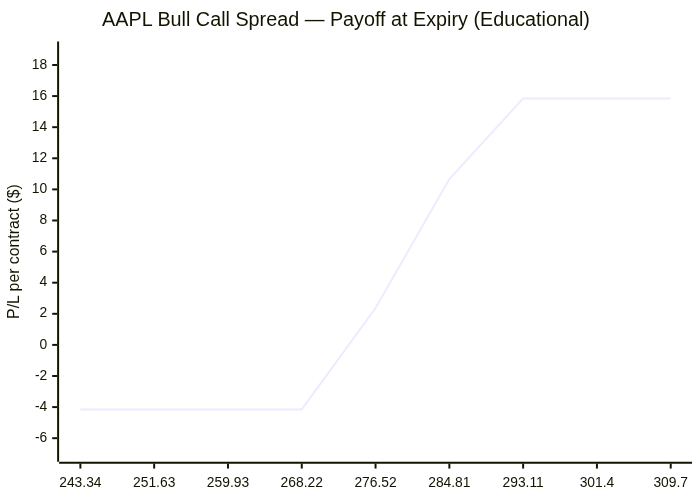
AAPL: Bull Call Spread
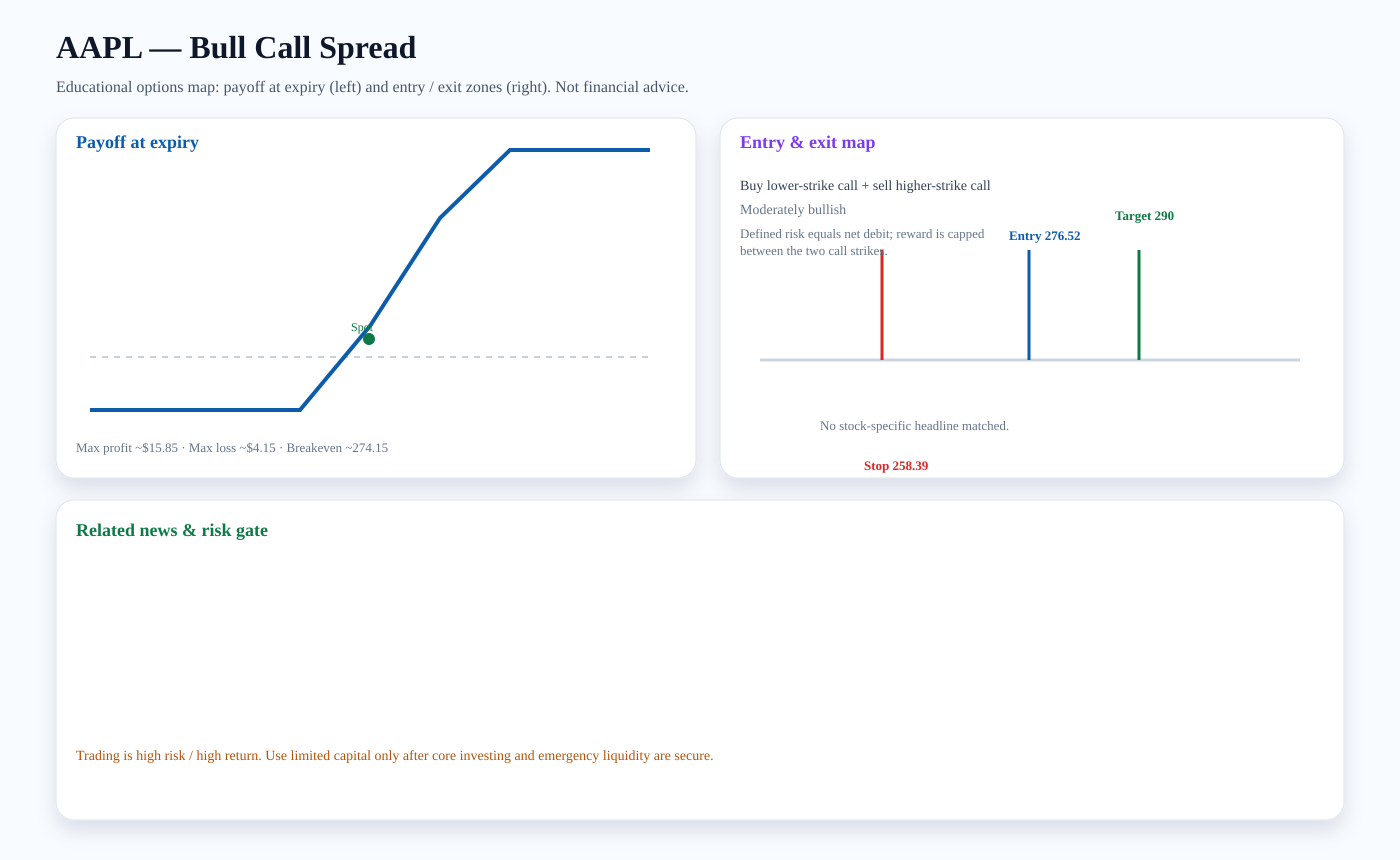
Structure: Buy lower-strike call + sell higher-strike call
Outlook: Moderately bullish
Entry zone: ~276.52 · Target: ~290 · Stop: ~258.39 · Breakeven: ~274.15
Risk note: Defined risk equals net debit; reward is capped between the two call strikes.
Payoff chart (Mermaid):
Entry / exit map (Mermaid):

Trading versus investing
Investing focuses on durable ownership, diversification, and compounding. Trading seeks faster tactical returns and carries higher risk. We treat options trading as limited-capital, educational analysis only after core investment capital and emergency liquidity are protected.
PDF report — Premium
Premium members get the full PDF attached to email briefs and can download it here. Upgrade for just $2 a month.
Subscribe for $2/month