
US Market Intelligence Brief
Report as-of (US/Eastern): 2026-06-30 09:04:30 EDT
Executive summary
Report as-of (US/Eastern): 2026-06-30 09:04:30 EDT
The US market is showing mixed signals with semiconductor equipment leader AMAT surging +12.79% to $707 on heavy volume, while aerospace name HONA retreats -4.75% to $220.22. The trending list is dominated by semiconductor and clean energy names (AMAT, ENPH, SEDG), suggesting sector rotation into technology infrastructure plays. AMAT's massive +54.47% monthly gain signals sustained semiconductor equipment demand, though the lack of specific news coverage creates uncertainty around catalyst durability.
Market regime check (S&P 500 + sector/thematic ETFs)
No major ETF data captured in today's snapshot, limiting macro regime assessment. However, the prominence of semiconductor equipment (AMAT) and clean energy infrastructure (ENPH, SEDG) in trending names suggests potential rotation toward technology infrastructure and renewable energy themes. The +12.79% gap-up in mega-cap AMAT indicates institutional conviction in semiconductor equipment demand, which typically correlates with broader technology sector strength.
Why these names are trending (search momentum + weekly/monthly price action)
AMAT (Applied Materials) leads with exceptional momentum: +8.51% weekly, +54.47% monthly, capped by today's +12.79% gap-up on 13.9M volume (well above typical levels). This suggests sustained institutional accumulation in semiconductor equipment space.
HONA (Honeywell Aerospace) trending for negative reasons: -15.65% weekly decline with 8.45M volume (7x normal), indicating potential sector headwinds or company-specific issues in aerospace.
The trending list's concentration in semiconductors (AMAT) and clean energy (ENPH, SEDG) suggests thematic momentum around infrastructure technology plays rather than broad market strength.
Key news drivers
Limited news visibility – No specific catalysts captured from major news sources, creating uncertainty around sustainability of moves. AMAT's +12.79% gap suggests material positive catalyst (likely earnings beat or guidance raise), while HONA's volume spike indicates undisclosed negative development.
Broader tech themes emerging from curated headlines include AI infrastructure competition (China supercomputers, OpenAI restrictions, Anthropic developments) and supply chain security (Tesla battery theft), which could support semiconductor equipment demand thesis.
Durable momentum ideas (mid/high-cap focus)
AMAT (Applied Materials) – Primary bullish case:
- Mega-cap with +54.47% monthly performance suggests institutional conviction
- Semiconductor equipment benefits from AI infrastructure buildout and geopolitical supply chain reshoring
- Gap-up on heavy volume indicates potential earnings beat or major contract wins
- Weekly +8.51% shows sustained momentum beyond today's move
Momentum sustainability factors:
- Global semiconductor capex cycle appears robust
- AI infrastructure demand driving equipment orders
- Geopolitical tensions supporting domestic chip manufacturing investment
Options / structure ideas
*This is educational analysis, not financial advice.*
AMAT – Primary CALL bias
Strong bullish momentum play
- Call debit spread: Buy 705C / Sell 720C (2026-07-10 expiry) targeting breakout above $720
- Put-side opportunity: Cash-secured puts at 680P-690P for pullback entries
- Risk: Wide bid/ask spreads noted (both ATM options showing $0.00 spreads despite volume)
- Key levels: Gap fill risk back to $627-650 range vs. breakout above $720
HONA – Primary PUT bias
Bearish momentum continuation
- Put debit spread: Target further decline toward $210-215 support
- Call-side: Counter-trend bounce plays toward $225-230 resistance (lower conviction)
- Critical limitation: No options chain data available – verify options liquidity before execution
- Risk: High institutional volume could signal reversal setup
Risks & watch-outs
Execution risks:
- AMAT options showing concerning bid/ask spread issues despite volume
- HONA options chain unavailable – liquidity unknown
Market structure risks:
- Limited news visibility creates catalyst uncertainty
- Sector concentration in trending names suggests narrow leadership
- Gap moves (both AMAT up, HONA down) prone to reversal without sustained catalysts
Macro risks:
- No broad market ETF data limits regime assessment
- Technology infrastructure momentum vulnerable to interest rate or growth concerns
- Geopolitical tensions around semiconductor supply chains create volatility risk
Key monitoring points:
- AMAT gap fill potential back toward $650-680 range
- HONA volume patterns for institutional accumulation vs. distribution
- Broader semiconductor sector confirmation of AMAT's strength
Visual strategy maps
Payoff curves and entry/exit zones below are educational aids — not trade instructions. Confirm with your own chart, liquidity, and risk limits.
AMAT: Bull Call Spread
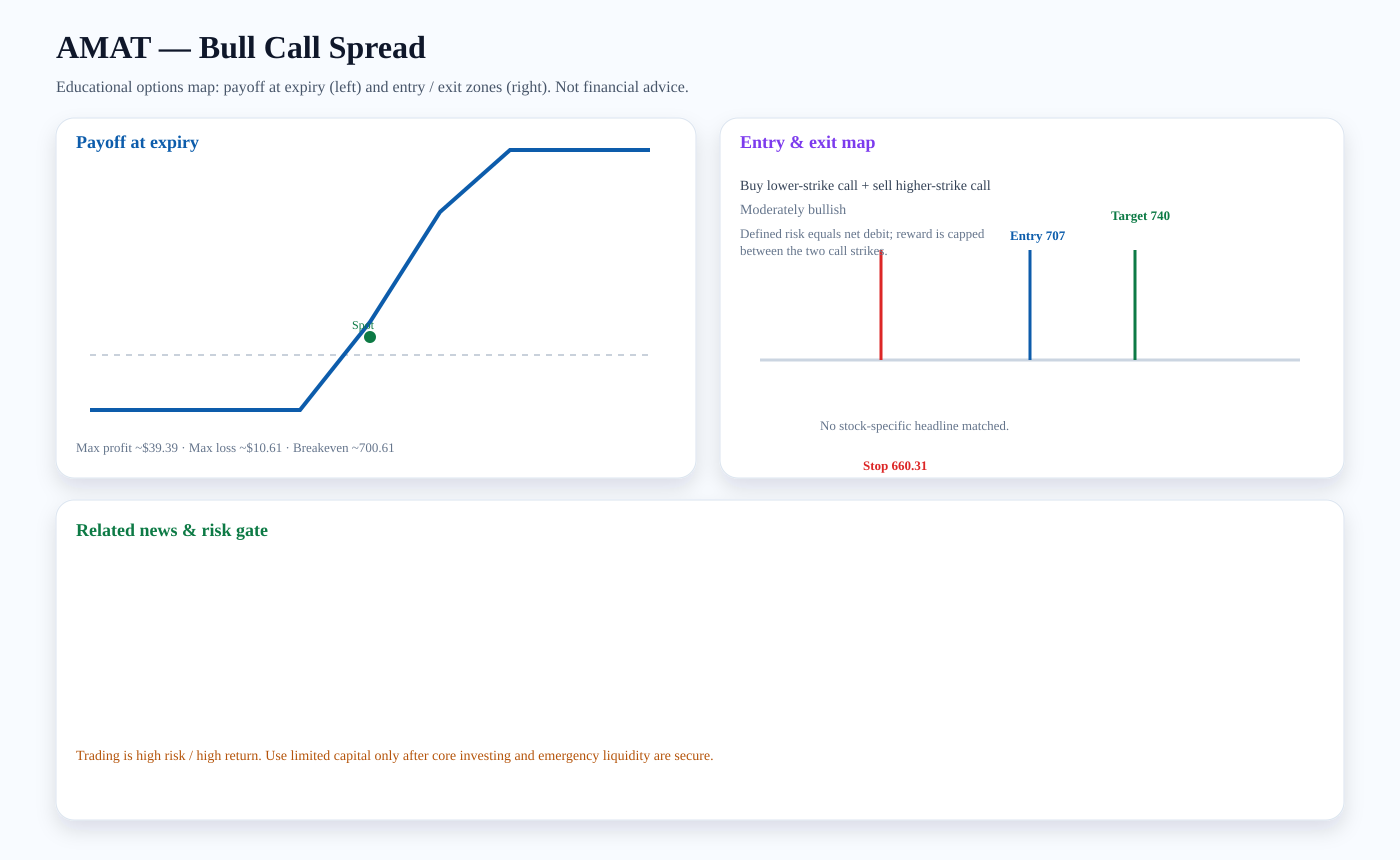
Structure: Buy lower-strike call + sell higher-strike call
Outlook: Moderately bullish
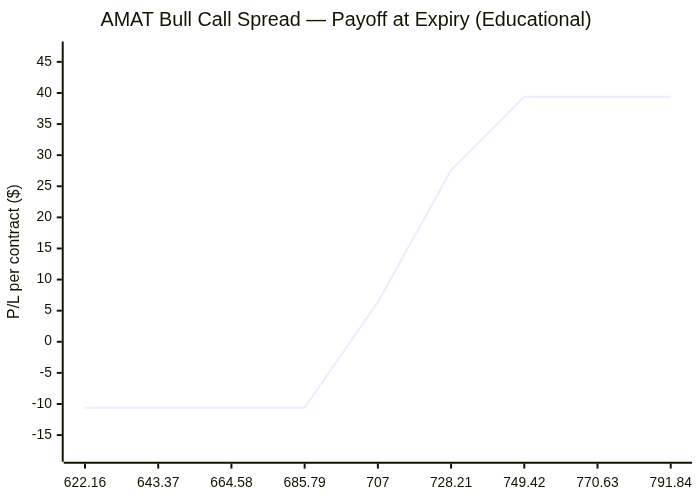
Entry zone: ~707 · Target: ~740 · Stop: ~660.31 · Breakeven: ~700.61
Risk note: Defined risk equals net debit; reward is capped between the two call strikes.
Payoff chart (Mermaid):
Entry / exit map (Mermaid):

HONA: Bear Put Spread
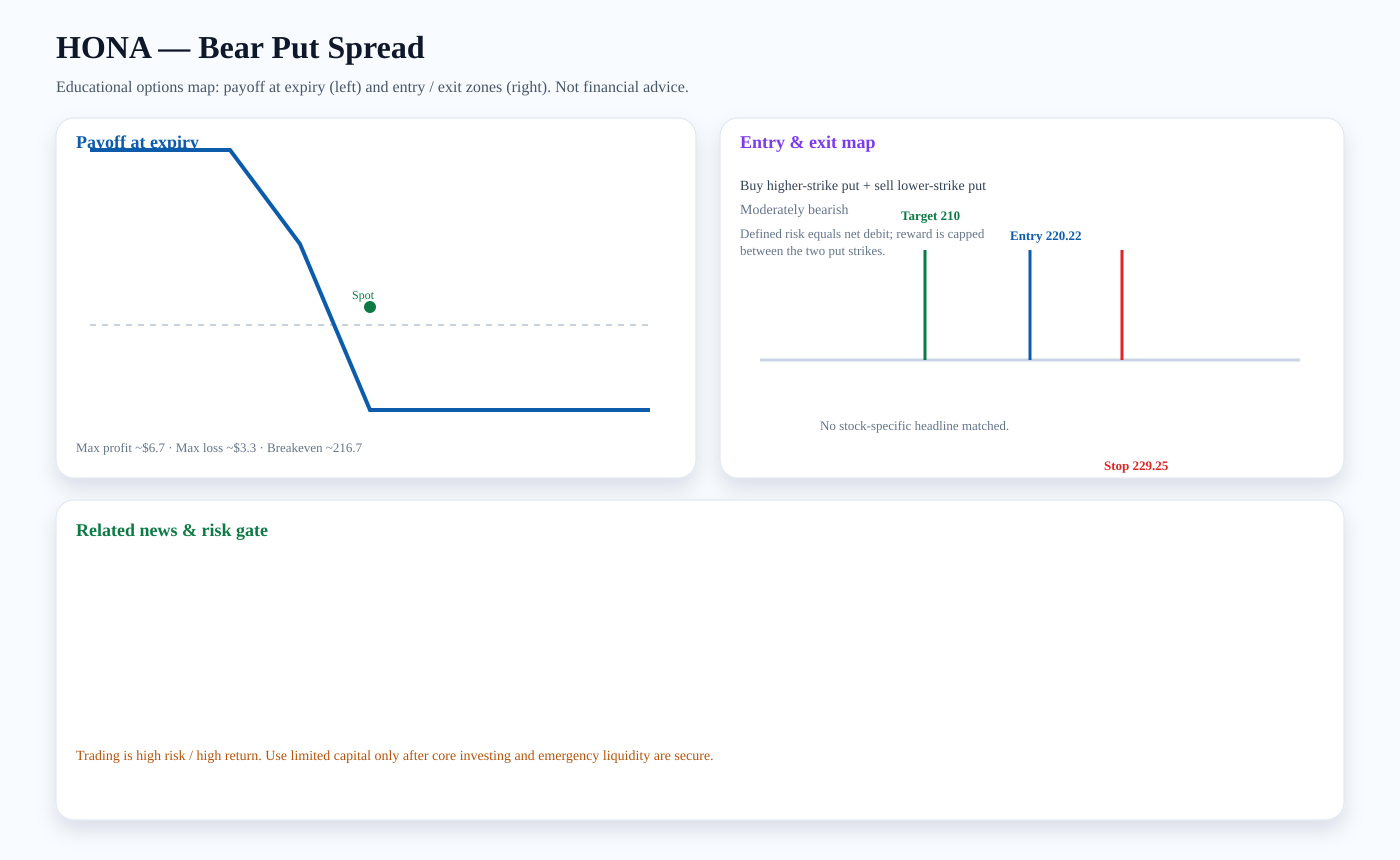
Structure: Buy higher-strike put + sell lower-strike put
Outlook: Moderately bearish
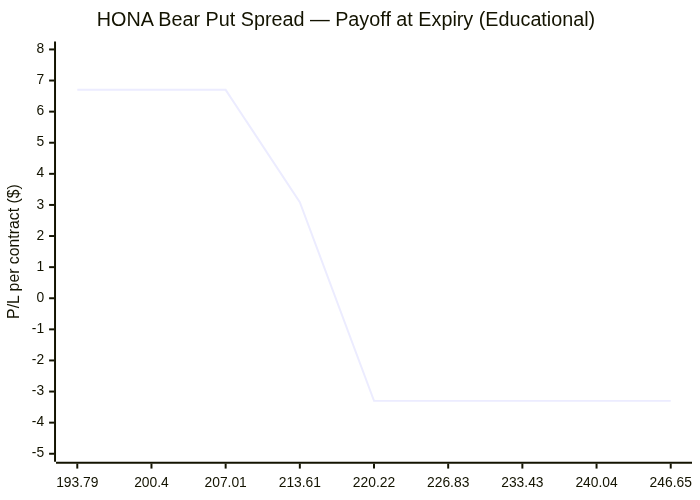
Entry zone: ~220.22 · Target: ~210 · Stop: ~229.25 · Breakeven: ~216.7
Risk note: Defined risk equals net debit; reward is capped between the two put strikes.
Payoff chart (Mermaid):
Entry / exit map (Mermaid):

Trading versus investing
Investing focuses on durable ownership, diversification, and compounding. Trading seeks faster tactical returns and carries higher risk. We treat options trading as limited-capital, educational analysis only after core investment capital and emergency liquidity are protected.
PDF report — Premium
Premium members get the full PDF attached to email briefs and can download it here. Upgrade for just $2 a month.
Subscribe for $2/month